Fig. 1.
Download original image
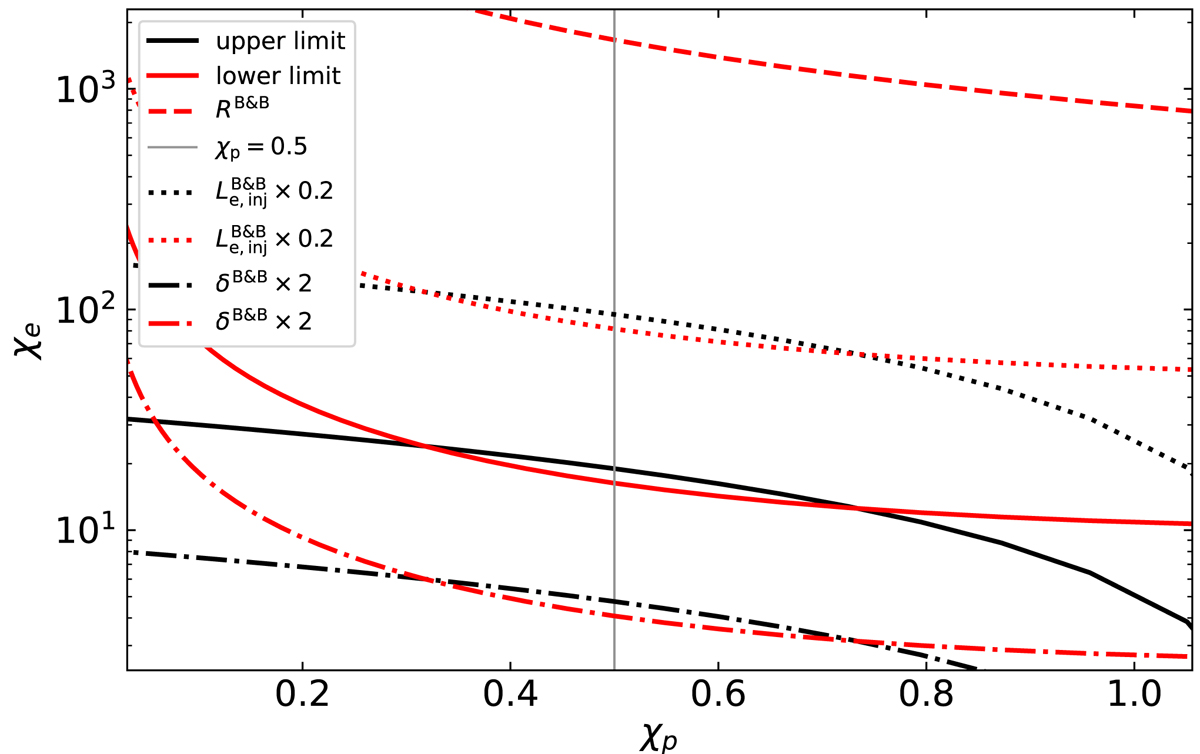
Comparison of χe as a function of χp derived by Eq. (21) with different parameters. For all the line styles, the black and red curves represent the upper and lower limits, respectively. The solid curves are obtained when setting R as the maximum value given in Table 1 and values of other parameters as those provided by Banik & Bhadra (2019). Based on this, the dotted curves show the upper and lower limits when setting the electron injection luminosity to ![]() , the dashed-dotted curves show the upper and lower limits when setting the Doppler factor to δB and B × 2, and the dashed curve shows the lower limit when setting the blob radius to that used in Banik & Bhadra (2019). The vertical line represents χp = 0.5.
, the dashed-dotted curves show the upper and lower limits when setting the Doppler factor to δB and B × 2, and the dashed curve shows the lower limit when setting the blob radius to that used in Banik & Bhadra (2019). The vertical line represents χp = 0.5.
Current usage metrics show cumulative count of Article Views (full-text article views including HTML views, PDF and ePub downloads, according to the available data) and Abstracts Views on Vision4Press platform.
Data correspond to usage on the plateform after 2015. The current usage metrics is available 48-96 hours after online publication and is updated daily on week days.
Initial download of the metrics may take a while.