Fig. 7.
Download original image
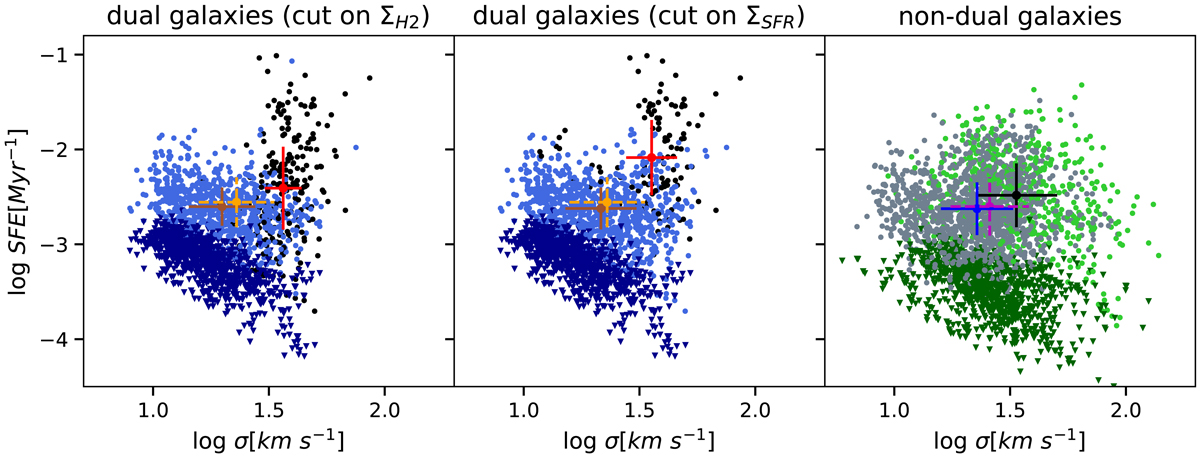
SF efficiency of the molecular gas as a function of the velocity dispersion of the gas (σ) at 90 pc scales. Left and middle panels: cut on the ΣH2 and ΣSFR axis for each galaxy, respectively. Colours are as in previous figures. The red and brown points and error bars indicate the mean and mean absolute deviation for the regions in high- and low-N regimes, respectively. Right panel: similar to the left and middle panels, but for non-dual galaxies. The central regions (r < 0.50 kpc) are represented in green and the more external regions in grey. The black and blue points and error bars correspond to the mean and mean absolute deviation values of the central and external regions, respectively. The orange and magenta points and error bars are the mean and mean absolute deviation for all the regions in each panel. The inverted triangles indicate upper limits.
Current usage metrics show cumulative count of Article Views (full-text article views including HTML views, PDF and ePub downloads, according to the available data) and Abstracts Views on Vision4Press platform.
Data correspond to usage on the plateform after 2015. The current usage metrics is available 48-96 hours after online publication and is updated daily on week days.
Initial download of the metrics may take a while.