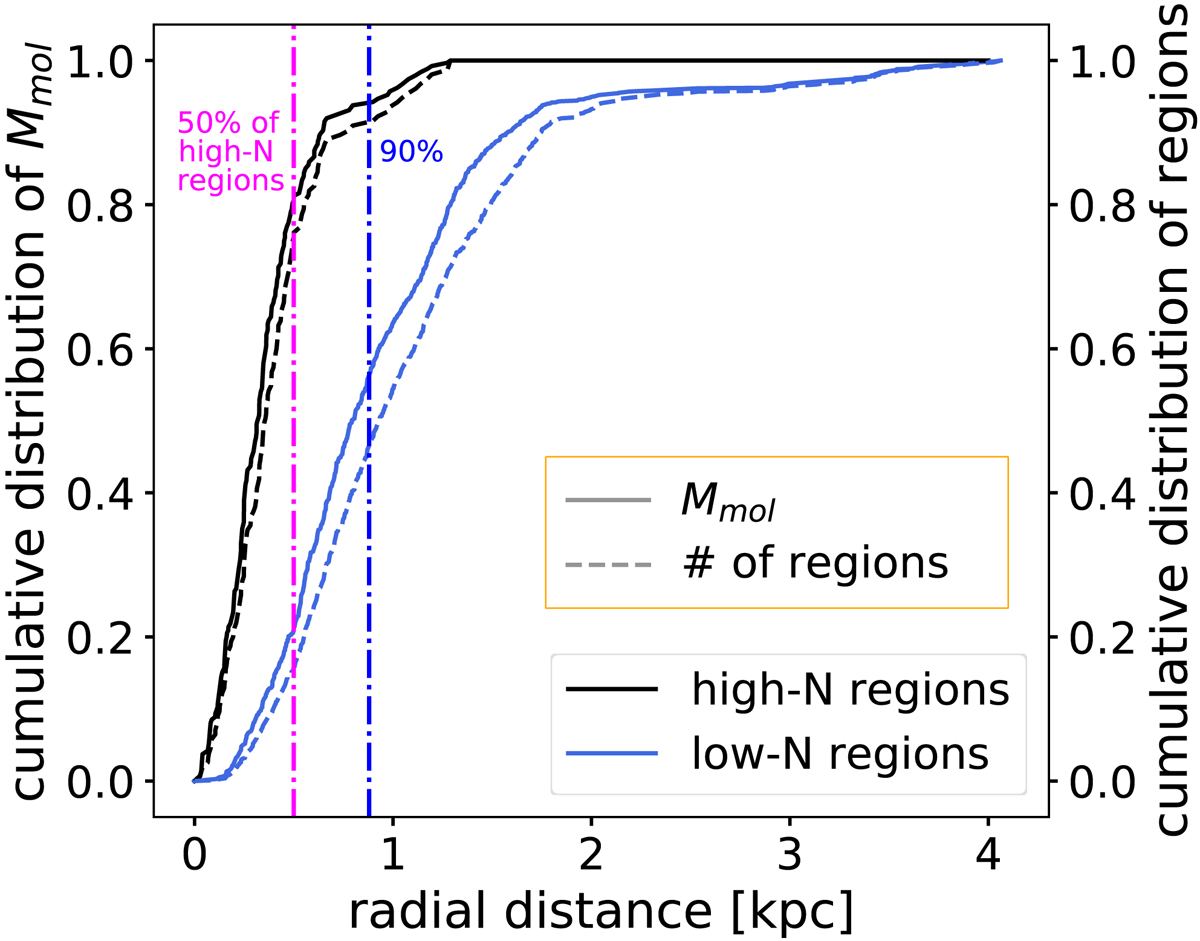
Fig. 5.
Download original image
Cumulative distribution of the molecular mass (left vertical axis and solid lines) of the 90 pc regions in the dual galaxies, selected applying a cut on ΣH2, as a function of the radial distance. The dashed lines (right vertical axis) show the cumulative distribution of the number of regions in each branch. Colours are as in Fig. 1. The dash-dotted lines correspond to the radii that include a percentage of regions.
Current usage metrics show cumulative count of Article Views (full-text article views including HTML views, PDF and ePub downloads, according to the available data) and Abstracts Views on Vision4Press platform.
Data correspond to usage on the plateform after 2015. The current usage metrics is available 48-96 hours after online publication and is updated daily on week days.
Initial download of the metrics may take a while.