Fig. 2.
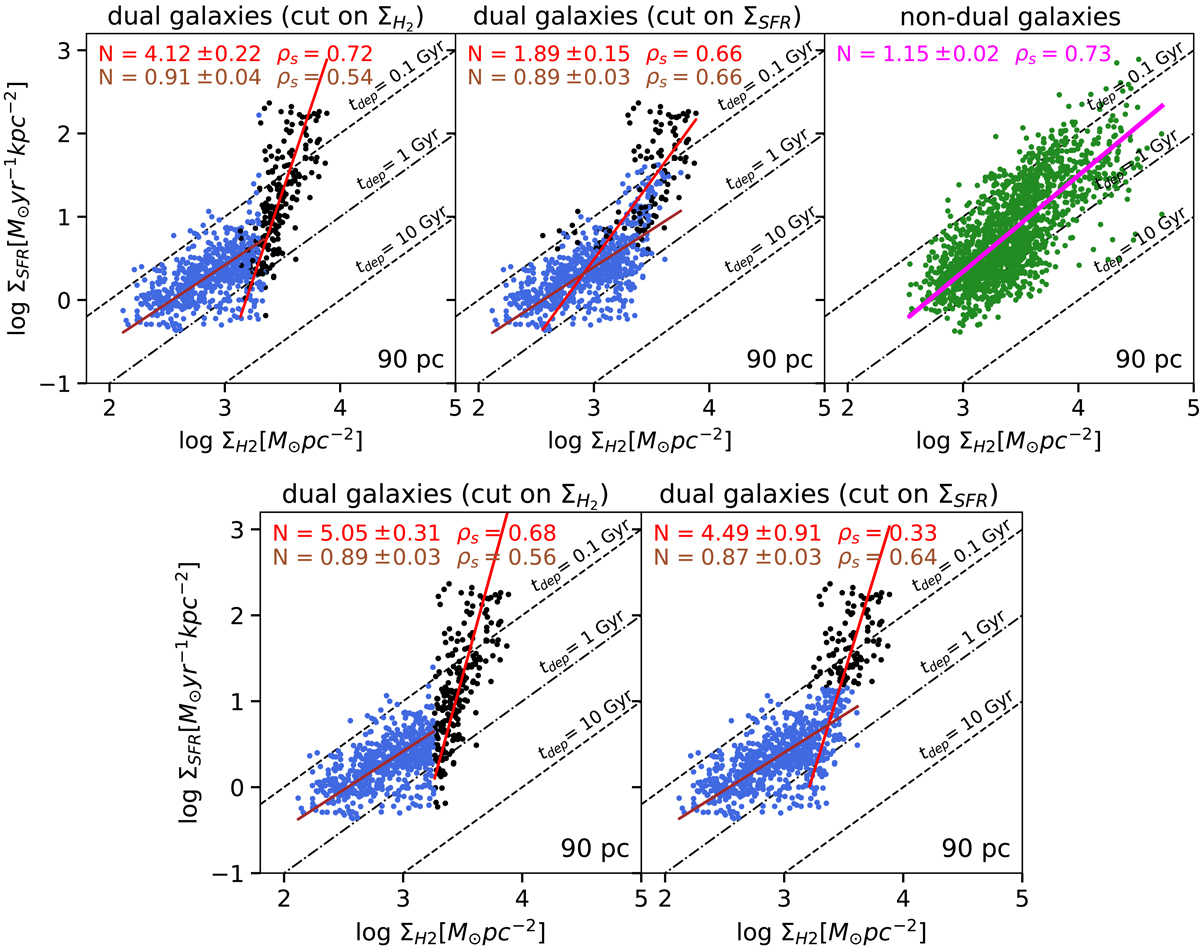
Download original image
SFR surface density as a function of the molecular gas surface density using 90 (110) pc regions. Top left and top middle panels: the black and blue points correspond to the two different regimes (branches) identified in the four dual galaxies using the MARS method in each individual galaxy. Top right: the green circles correspond to the regions in the remaining 12 galaxies. Bottom row: the black and blue points correspond to the two branches identified using the MARS method in all the regions from the dual galaxies. The red, brown, and magenta solid lines indicate the best fit for each regime. The dashed lines indicate constant tdep.
Current usage metrics show cumulative count of Article Views (full-text article views including HTML views, PDF and ePub downloads, according to the available data) and Abstracts Views on Vision4Press platform.
Data correspond to usage on the plateform after 2015. The current usage metrics is available 48-96 hours after online publication and is updated daily on week days.
Initial download of the metrics may take a while.