Fig. A.3.
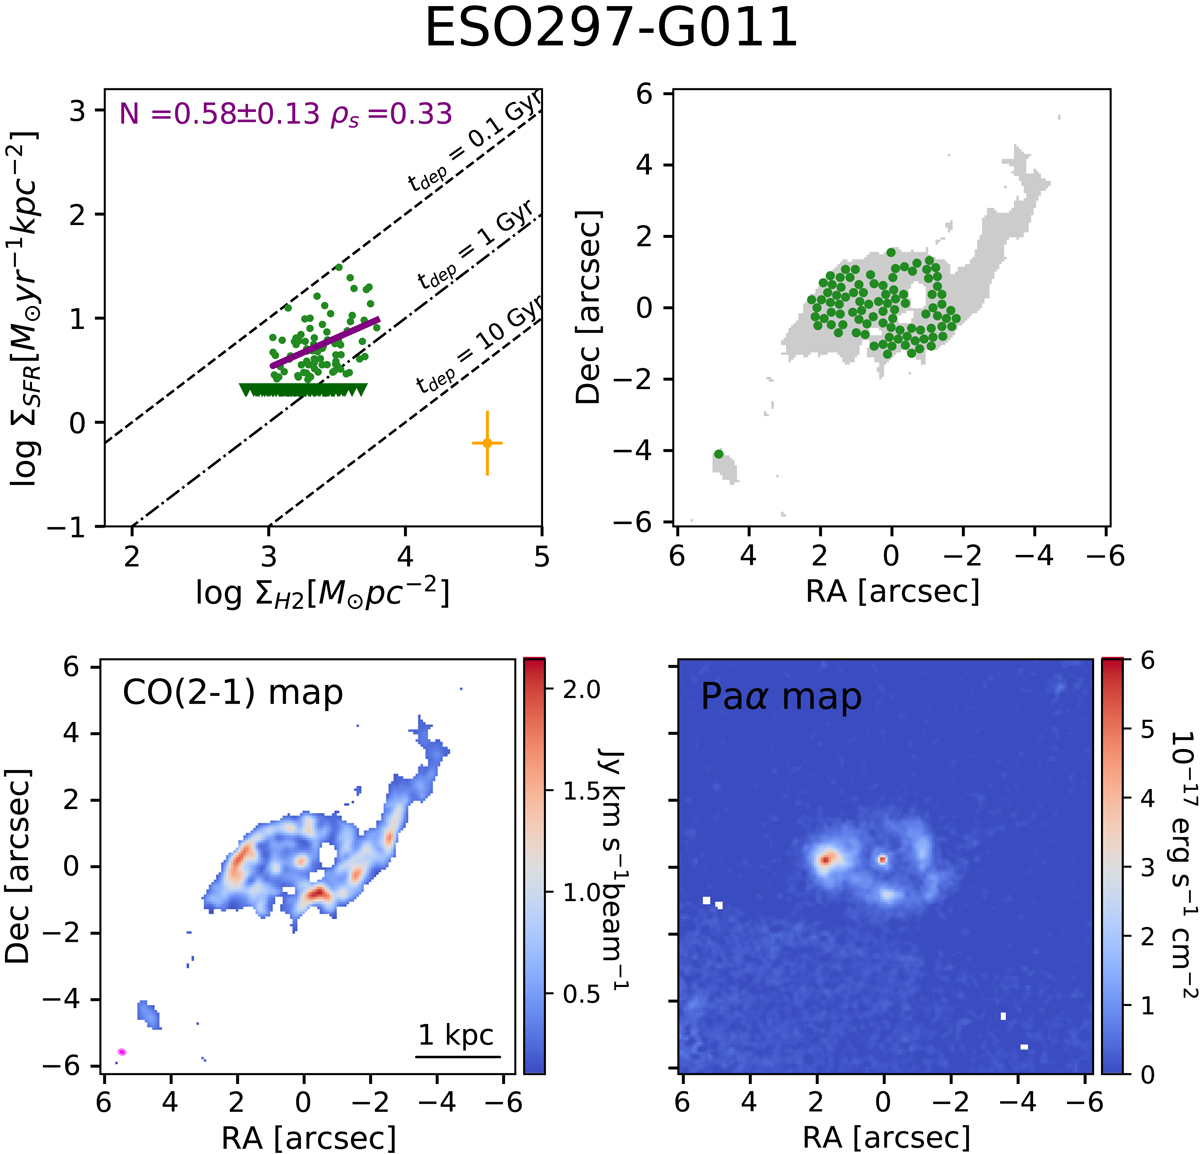
Download original image
Same as Fig. A.1. Top left panel: SFR surface density (ΣSFR) as a function of the molecular gas surface density (ΣH2) for the non-dual galaxies in the sample using 90 pc regions. The green circles indicate data points in each galaxy. The solid purple line indicates the best fit. The Spearman’s rank correlation coefficients (ρs) and the power-law index (N) of the derived best-fit KS relation are shown in the figure. The dashed lines indicate constant tdep values. Topright: Location of the regions on the CO(2–1) map (grey). Bottom panels: ALMA CO(2–1) (left) and HST/NICMOS Paα (right) maps.
Current usage metrics show cumulative count of Article Views (full-text article views including HTML views, PDF and ePub downloads, according to the available data) and Abstracts Views on Vision4Press platform.
Data correspond to usage on the plateform after 2015. The current usage metrics is available 48-96 hours after online publication and is updated daily on week days.
Initial download of the metrics may take a while.