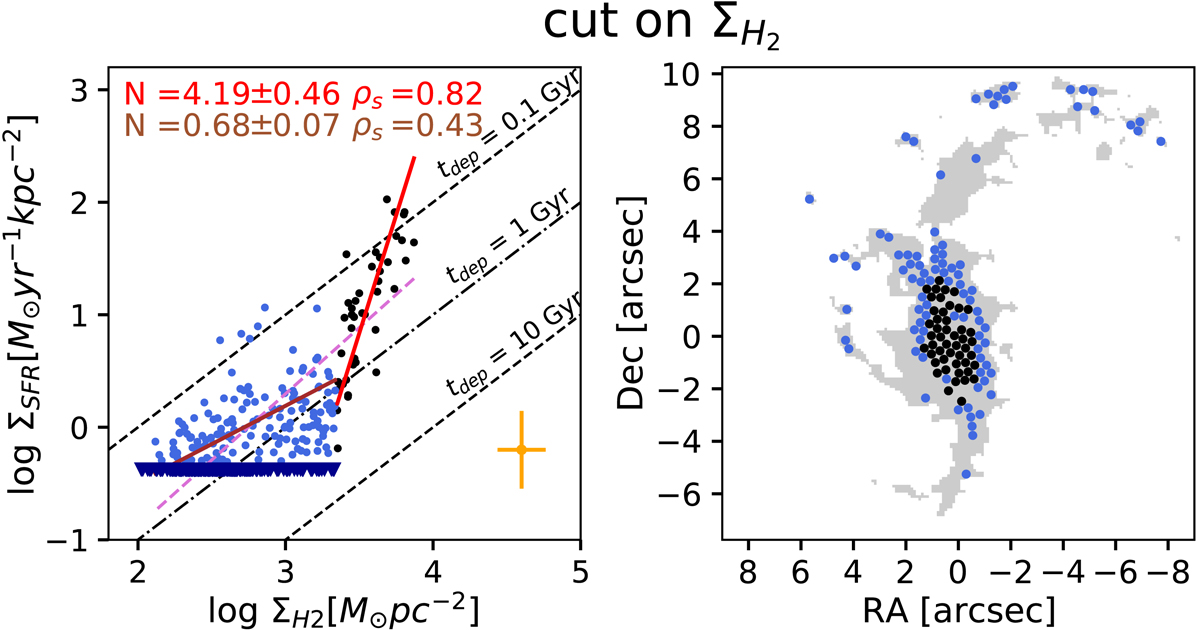
Fig. 1.
Download original image
Star formation relation and location of the regions considered in NGC 7130. Left panel: SFR surface density (ΣSFR) as a function of the molecular gas surface density (ΣH2) derived from CO(2–1) in NGC 7130 at 110 pc scale. The blue and black points show the two branches derived applying the MARS method with breaking points in the log ΣH2 axis. The black dashed lines mark constant depletion times (tdep = ΣH2/ΣSFR). The red and brown solid lines are the best fit for each branch. The Spearman’s rank correlation coefficients (ρs) and the power-law indices (N) of the derived best-fit KS relations are indicated. The pink dashed line is the best fit for whole points. The inverted triangles indicate upper limits. The error bars indicate the mean systematic uncertainties in ΣH2 of ±0.14 dex (horizontal) and the extinction correction in ΣSFR of ±0.21 dex (vertical). Right panel: Location of the regions on the CO(2–1) map (grey). The black and blue circles correspond to regions in each of the two branches.
Current usage metrics show cumulative count of Article Views (full-text article views including HTML views, PDF and ePub downloads, according to the available data) and Abstracts Views on Vision4Press platform.
Data correspond to usage on the plateform after 2015. The current usage metrics is available 48-96 hours after online publication and is updated daily on week days.
Initial download of the metrics may take a while.