Fig. 8.
Download original image
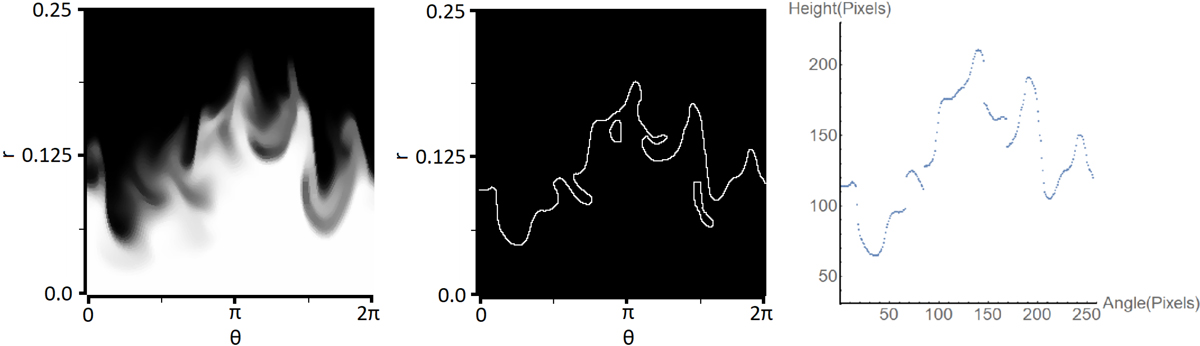
Steps for obtaining the boundary curve. Left: Polar transform of the density plot shown in Fig. 5, smoothed using the routine MedianFilter in Mathematica. Center: flux tube boundary identified from the polar transformed plot, using the routine MorphologicalPerimeter in Mathematica. Right: data points extracted from the flux tube boundary plot. Radius units are 10 Mm.
Current usage metrics show cumulative count of Article Views (full-text article views including HTML views, PDF and ePub downloads, according to the available data) and Abstracts Views on Vision4Press platform.
Data correspond to usage on the plateform after 2015. The current usage metrics is available 48-96 hours after online publication and is updated daily on week days.
Initial download of the metrics may take a while.