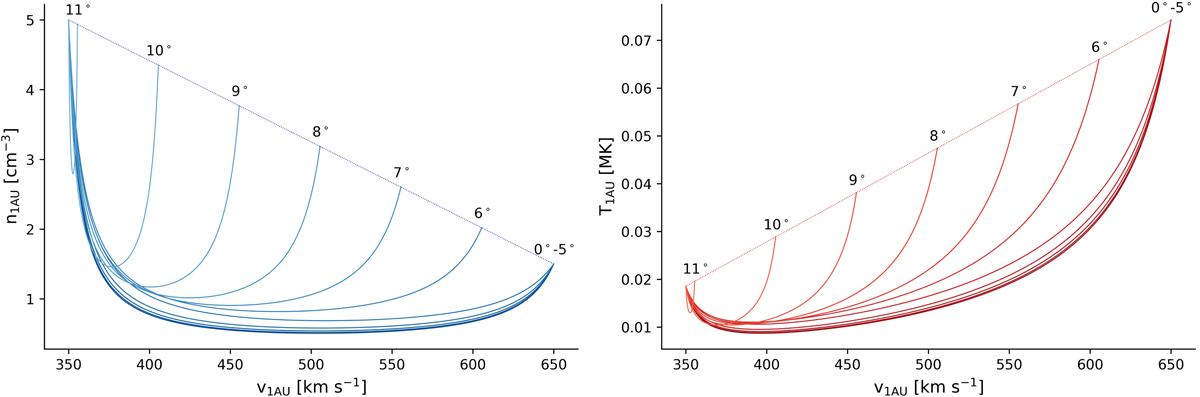
Fig. 3.
Download original image
Distribution of densities (left) and temperatures (right) of plasma parcels versus their velocities at 1 AU, as derived by Eq. (18) for an HSS with a diameter of 22°. Each line represents plasma parcels originating from a different longitudinal slice through the HSS, resulting in a different radial expansion. The numbers give the latitudinal displacement of the slice to the center of the HSS; slices > 5° lie entirely within the northern boundary region. For comparison, the dashed diagonal line shows the solution for the case in which the radial expansion of plasma parcels is neglected.
Current usage metrics show cumulative count of Article Views (full-text article views including HTML views, PDF and ePub downloads, according to the available data) and Abstracts Views on Vision4Press platform.
Data correspond to usage on the plateform after 2015. The current usage metrics is available 48-96 hours after online publication and is updated daily on week days.
Initial download of the metrics may take a while.