Fig. 2.
Download original image
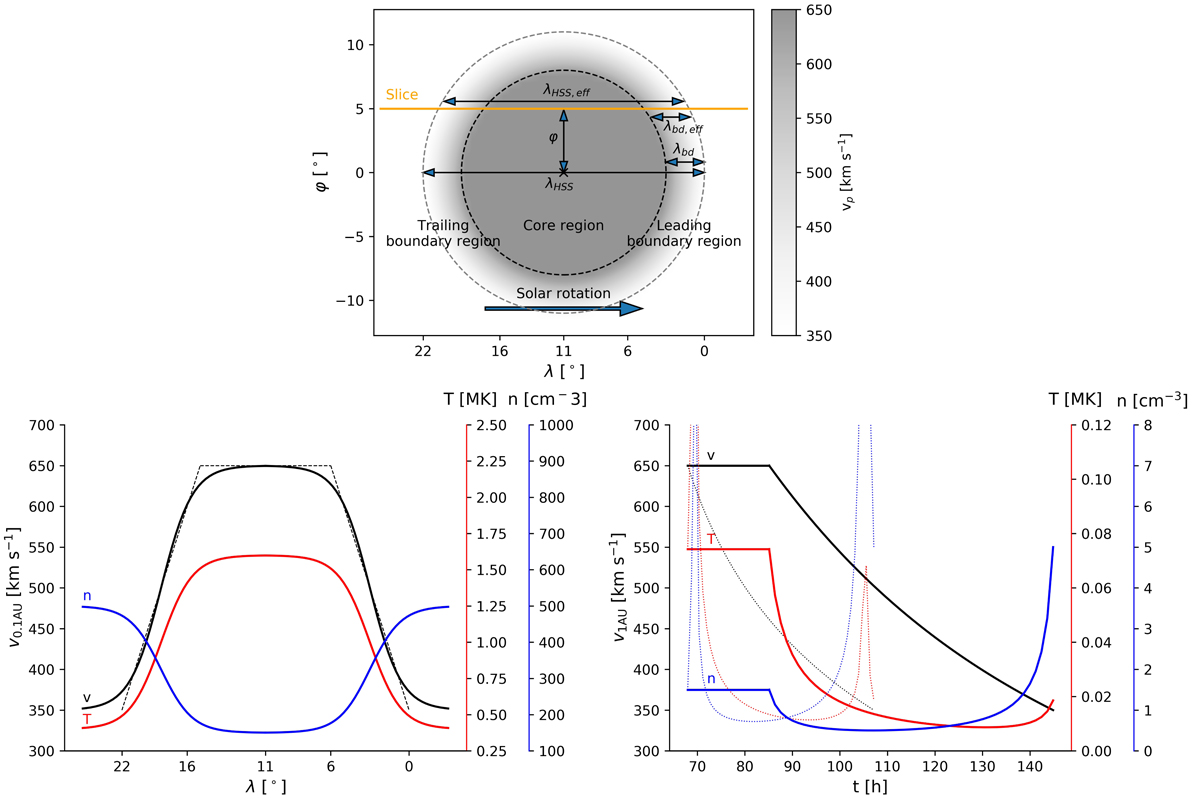
HSS properties close to the Sun and at 1 AU. Top: sketch of the velocity distribution across the cross section of the HSS at 0.1 AU, which has a longitudinal width of 22° and a width of the boundary region of 6°. Bottom left: velocity (black), temperature (red), and density distribution (blue) along the cross section of the HSS at 0.1 AU. The solid lines give the sigmoidal approximations, and the dashed black line the linear approximation for the velocity profile. Bottom right: dispersed temporal velocity distribution as seen at 1 AU and the associated temperature and density distributions. It should be noted that the dotted lines represent the mathematical solution for plasma originating from the leading boundary region at 0.1 AU of the HSS. These plasma parcels will have impinged upon the stream interface at 1 AU and thus cannot be observed.
Current usage metrics show cumulative count of Article Views (full-text article views including HTML views, PDF and ePub downloads, according to the available data) and Abstracts Views on Vision4Press platform.
Data correspond to usage on the plateform after 2015. The current usage metrics is available 48-96 hours after online publication and is updated daily on week days.
Initial download of the metrics may take a while.