Fig. 5.
Download original image
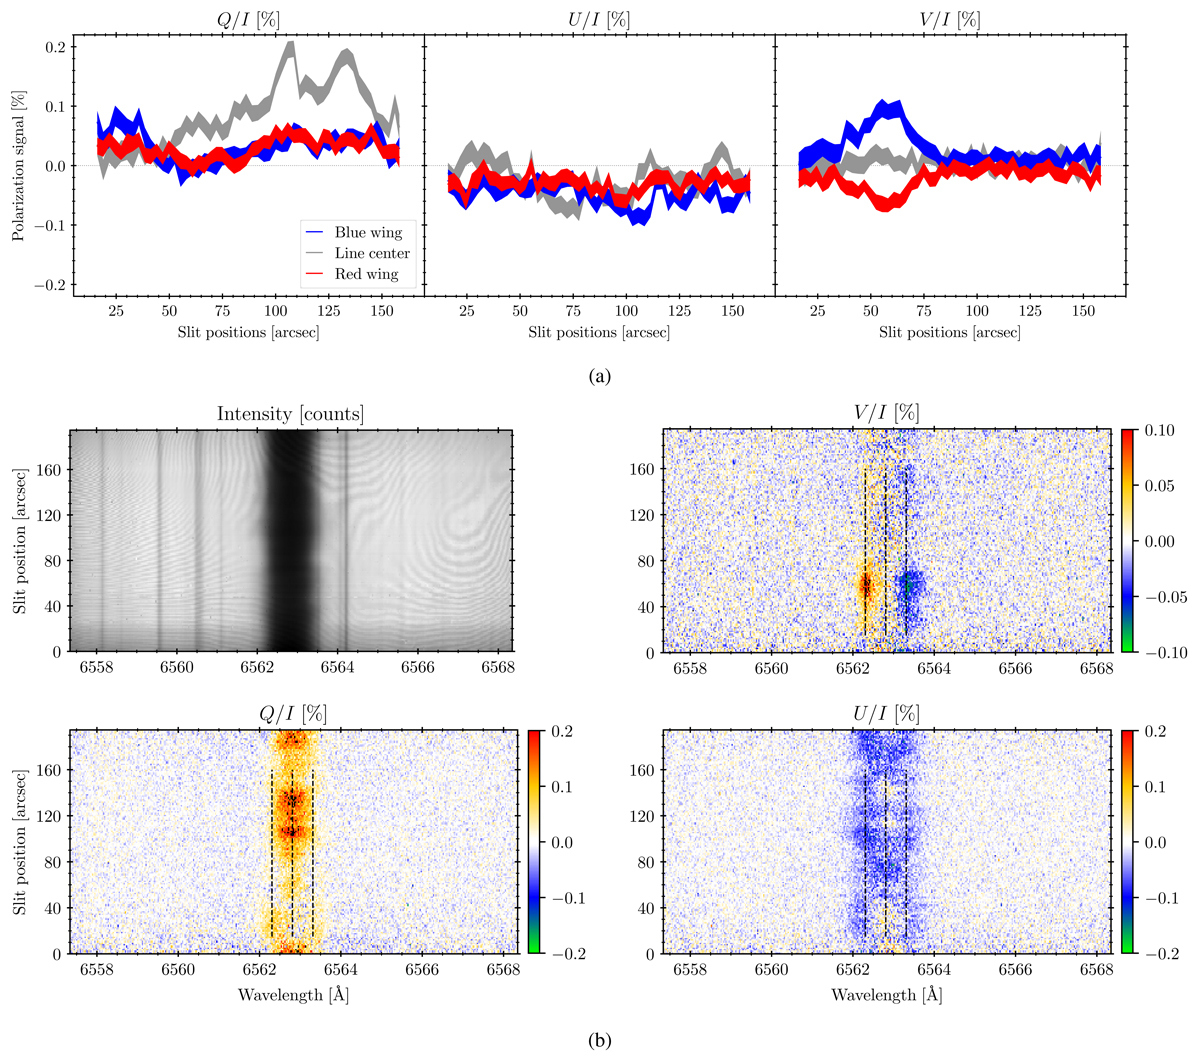
Spatial variations along the slit of the polarization signals. Panel a: spatial variation at three different wavelengths along a region of the slit of Q/I (left panel), U/I (central panel), and V/I (right panel). The line-center wavelength (gray line) is at λ0 = 6562.81 Å. The blue wing (blue line) is at λb = λ0 − 0.5 Å and the red wing (red line) is at λr = λ0 + 0.5 Å. The width of the curves indicates the noise level at each spatial pixel. The considered spatial region is shown by the three dashed lines in the panels below. A binning of 2 and 4 pixels along the spatial and spectral dimensions were applied in order to reduce the noise. The spatial resolution of the signals are about 6″. Panel b: spectropolarimetric images. The color scale saturates in black at ±0.2% for Q/I, and U/I and ±0.1% for V/I. The observation was taken at the heliospheric north limb at μ = 0.14. The observation ID is 03.
Current usage metrics show cumulative count of Article Views (full-text article views including HTML views, PDF and ePub downloads, according to the available data) and Abstracts Views on Vision4Press platform.
Data correspond to usage on the plateform after 2015. The current usage metrics is available 48-96 hours after online publication and is updated daily on week days.
Initial download of the metrics may take a while.