Fig. 9.

Download original image
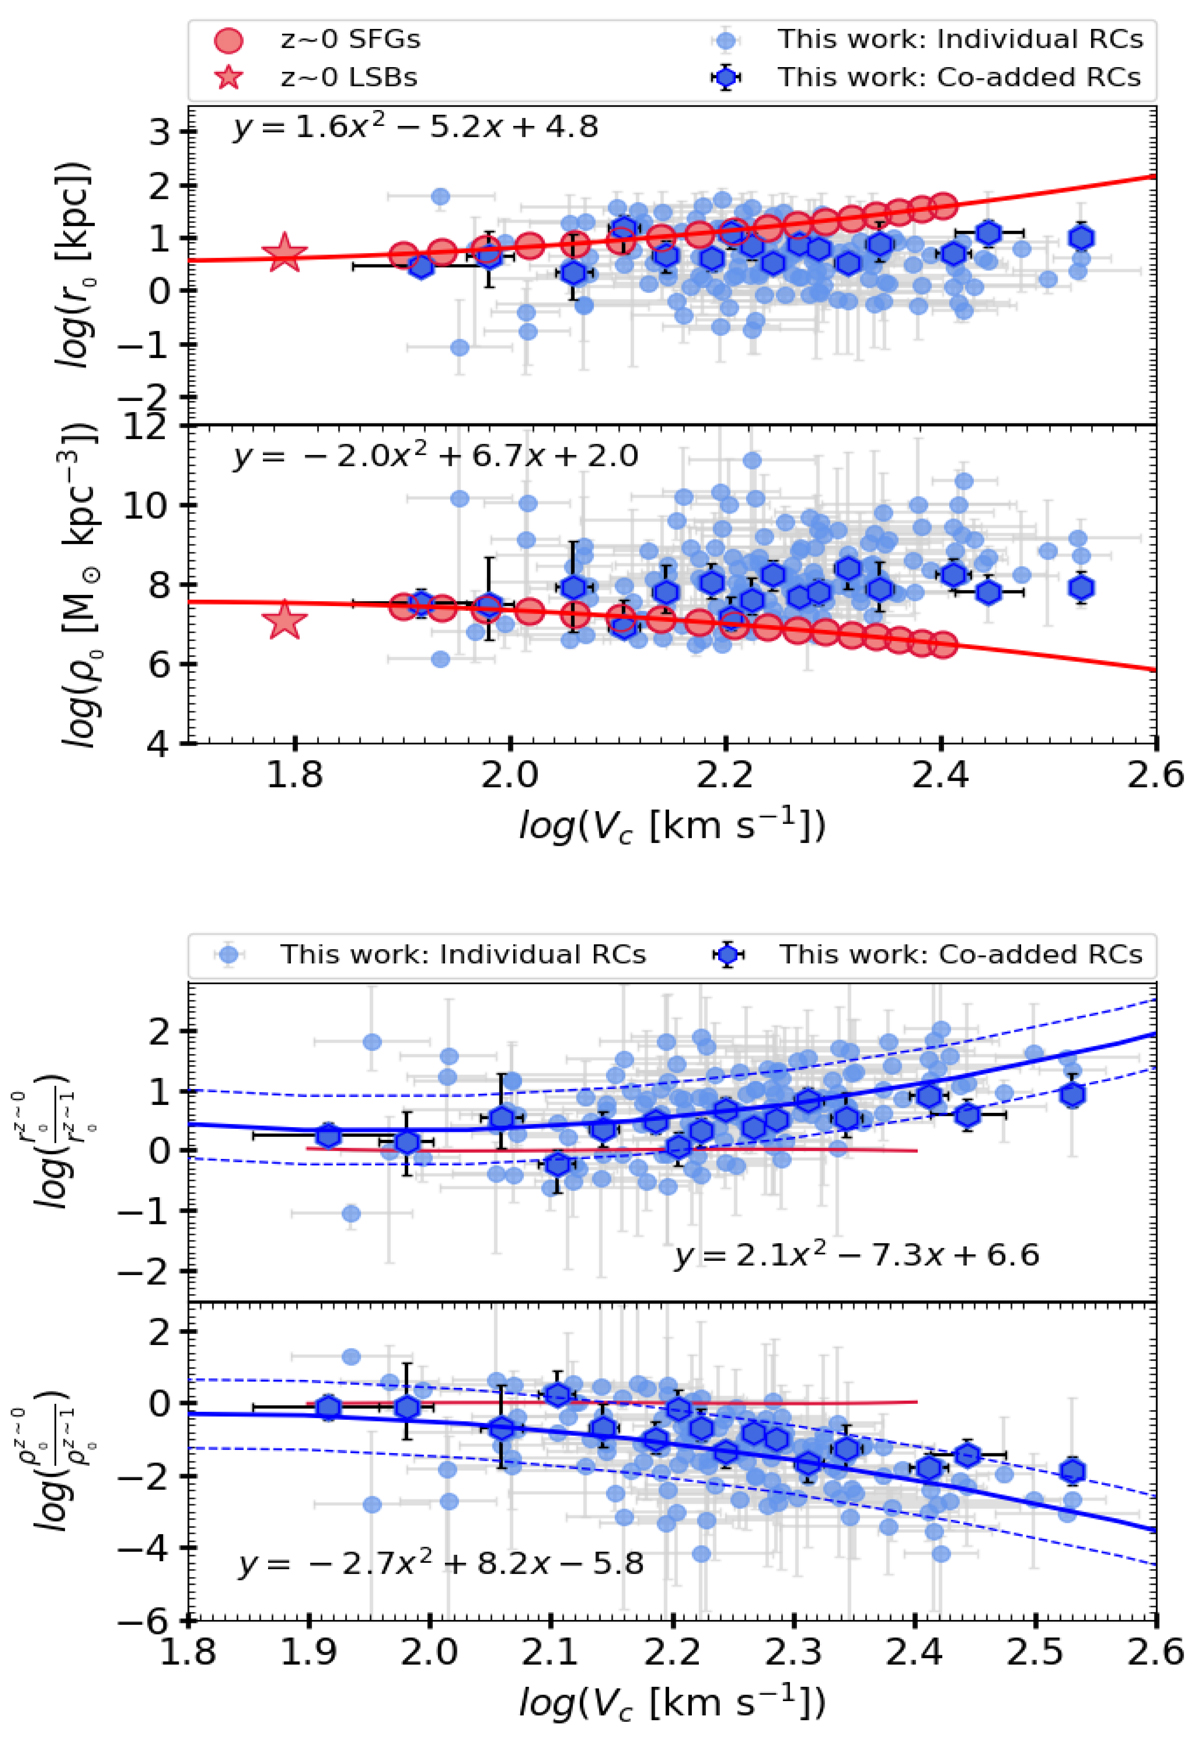
Structural properties of the DM halo at z ∼ 1. Top: DM core radius and core density as a function of the circular velocity shown in the upper and lower panels, respectively. The individual and coadded RC measurements are represented by small blue circles and hexagons, respectively. The comparison sample of local LSBs (Di Paolo et al. 2019) and SFGs (Persic et al. 1996; Lapi et al. 2018) are represented by the coral red stars and circles, respectively. The best-fit line (second-order polynomial) of the local SFGs and LSBs is represented by a red line, and the equation is printed in the upper left corner of each panel. As we can notice, the local SFGs lie above in the r0 − Vc plane and below in the ρ0 − Vc plane with respect to the z ∼ 1 SFGs. This is due to the fact that DM cores of z ∼ 1 SFGs are smaller and denser than their local counterparts, indicating an evolution in the structure of DM halos over cosmic time. Bottom: ratio of DM core radius and density at z ≈ 0 to z ∼ 1 as a function of circular velocity. This plot shows the expansion factor of DM cores at z ∼ 1 with respect to local SFGs. The color codes for data points are similar to those in the top panel. The blue solid line shows the best fit to the data, obtained by fitting the second order polynomial function printed in both panels. The dashed blue lines followed by a solid line shows the 1σ intrinsic scatter in the relations.
Current usage metrics show cumulative count of Article Views (full-text article views including HTML views, PDF and ePub downloads, according to the available data) and Abstracts Views on Vision4Press platform.
Data correspond to usage on the plateform after 2015. The current usage metrics is available 48-96 hours after online publication and is updated daily on week days.
Initial download of the metrics may take a while.


