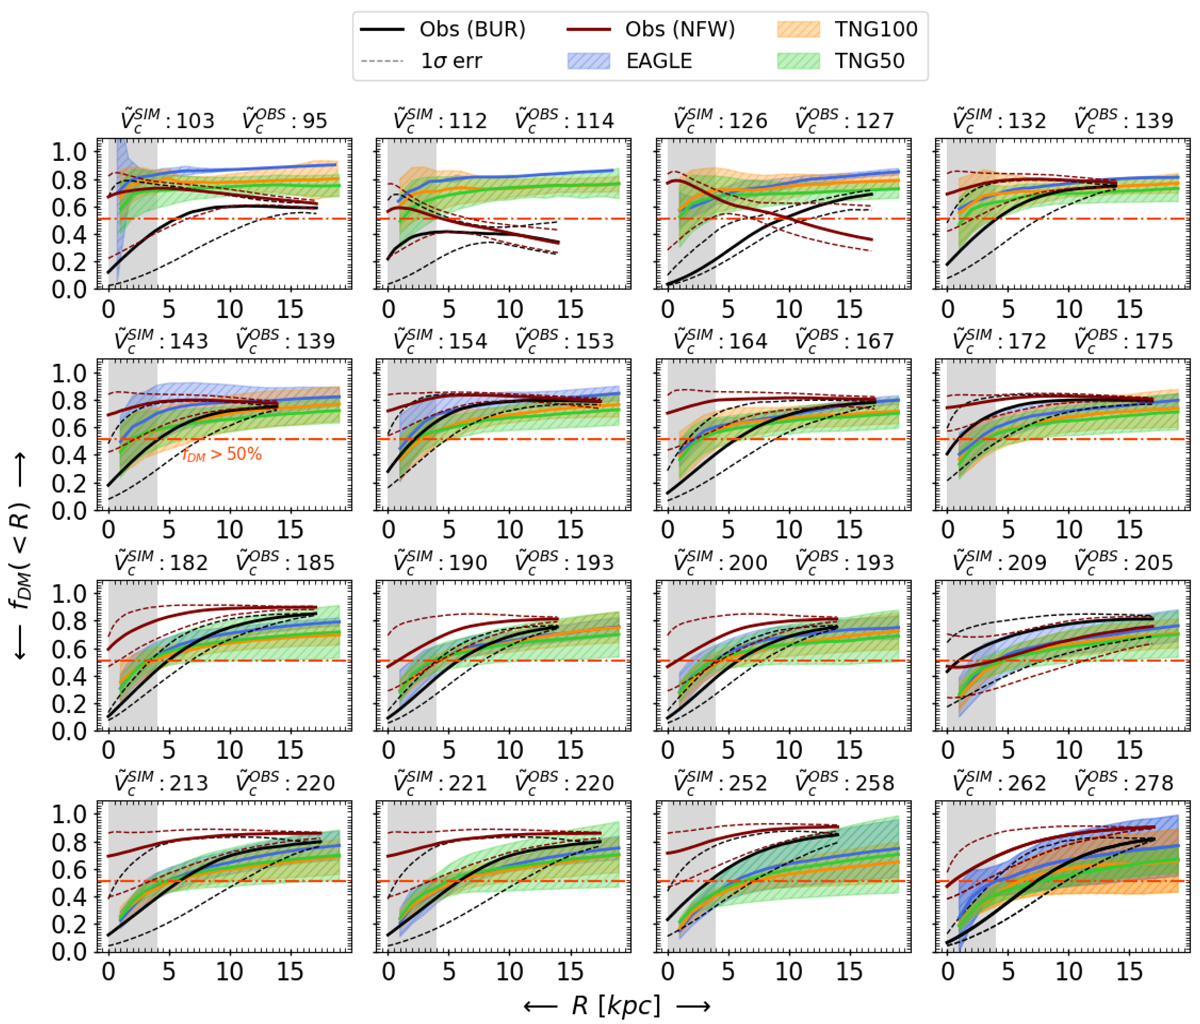
Fig. 8.

Download original image
DM fraction as a function of the radius in various velocity bins of observed and simulated galaxies. The central value of fDM(< R) is shown by solid lines in each case. The color code is the same in all panels and is as follows: EAGLE (blue), TNG100 (orange), TNG50 (green), observations in the case of the Burkert halo (black), and NFW halo (brown). In the simulations, the 1σ error in each measurement is represented by a shaded area; whereas in the observations, it is a dashed line following the same color code. The gray shaded area in each panel represents the unresolved region in the observations. The horizontal red dotted-dashed line in each panel shows the 51% DM fraction. The central value of the circular velocity of each bin is printed at the top of each panel, where ![]() and
and ![]() specify the simulations and observations, respectively.
specify the simulations and observations, respectively.
Current usage metrics show cumulative count of Article Views (full-text article views including HTML views, PDF and ePub downloads, according to the available data) and Abstracts Views on Vision4Press platform.
Data correspond to usage on the plateform after 2015. The current usage metrics is available 48-96 hours after online publication and is updated daily on week days.
Initial download of the metrics may take a while.


