Fig. 7.

Download original image
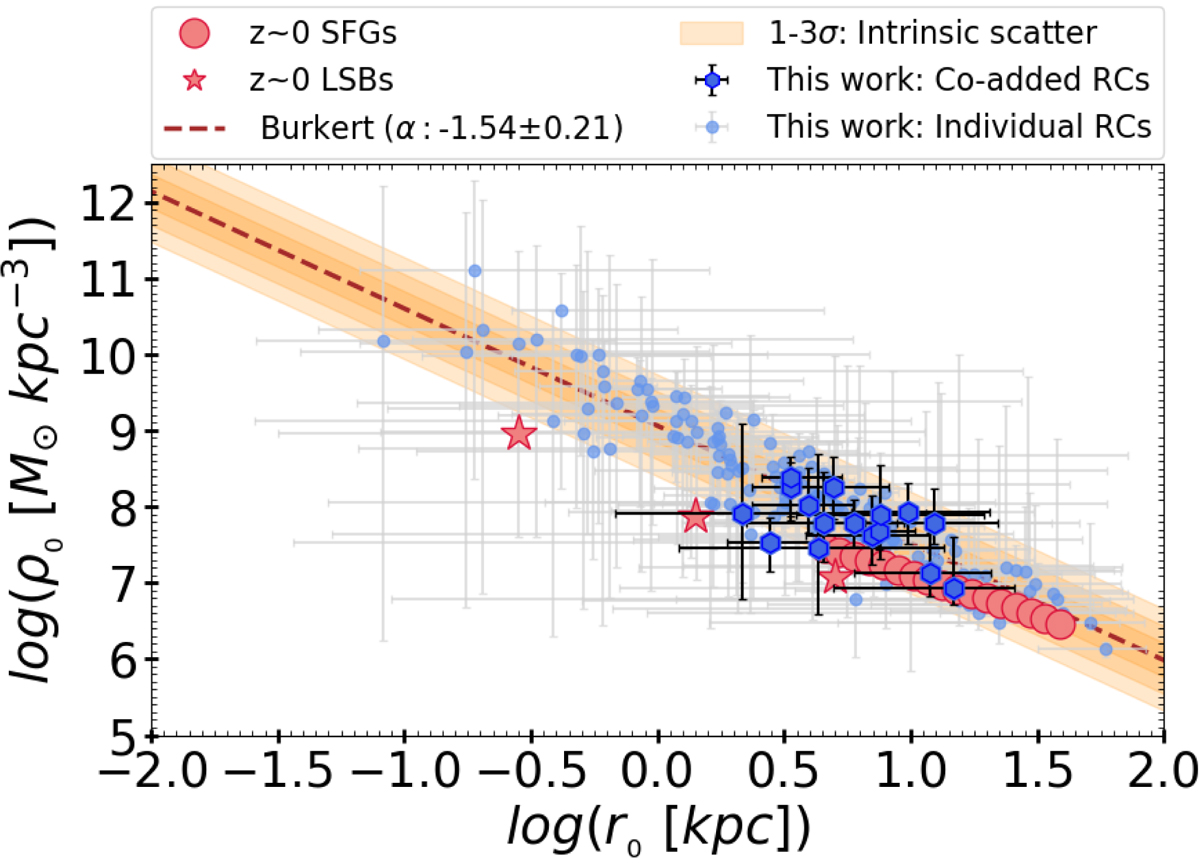
DM core density vs. core radius relation of local and high-z galaxies. The blue circles and hexagons represent the z ∼ 1 individual and coadded RCs, respectively. The coral red circles and stars represent the local star-forming and low surface brightness galaxies (Persic et al. 1996; Di Paolo et al. 2019), respectively. The brown dashed line is the best fit ![]() to z ∼ 1 data with a slope α = −1.54, and the orange shaded area represents the 1 − 3σ intrinsic scatter in the relation.
to z ∼ 1 data with a slope α = −1.54, and the orange shaded area represents the 1 − 3σ intrinsic scatter in the relation.
Current usage metrics show cumulative count of Article Views (full-text article views including HTML views, PDF and ePub downloads, according to the available data) and Abstracts Views on Vision4Press platform.
Data correspond to usage on the plateform after 2015. The current usage metrics is available 48-96 hours after online publication and is updated daily on week days.
Initial download of the metrics may take a while.


