Fig. 2.

Download original image
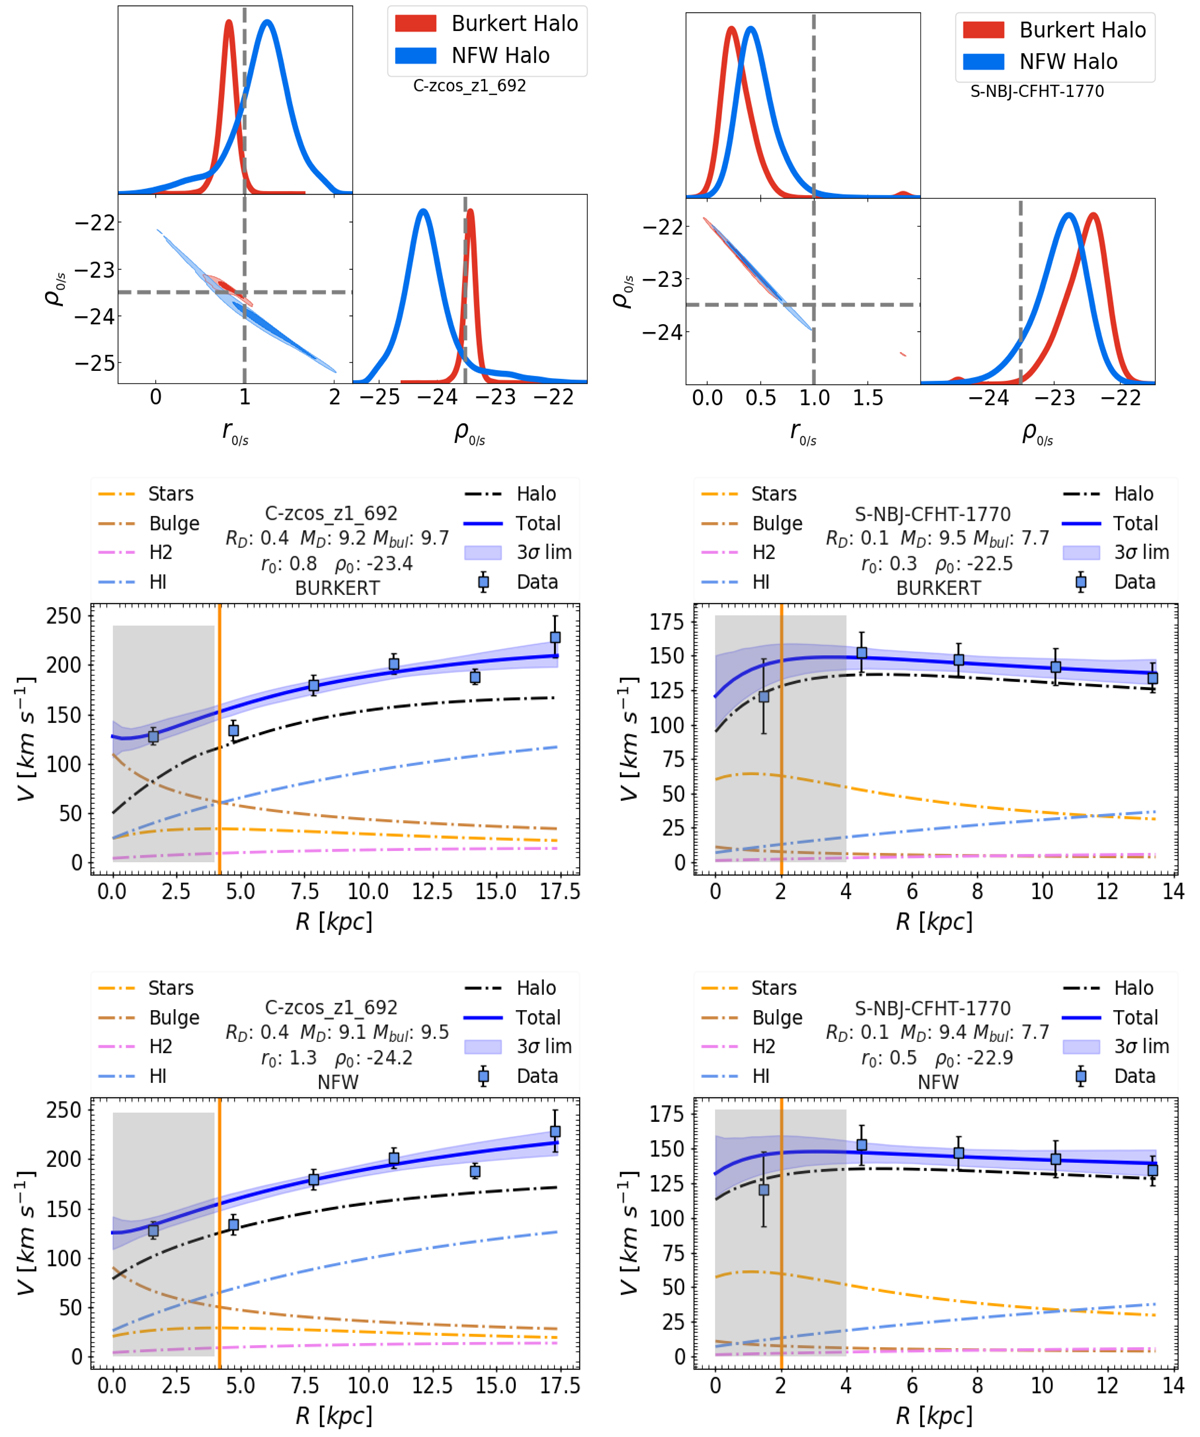
Individual RC mass modeling. Row 1: posterior distributions (MCMC output) of the following estimated parameters: r0 and ρ0 for Burkert (red) and rs and ρs for the NFW (blue) halo. The vertical and horizontal gray dashed lines show the initial guess for parameters r0/s and ρ0/s. The full posterior distribution of parameter space θ of these example cases are shown in Fig. D.1. Rows 2 and 3: best fit to the RCs and their velocity decomposition for Burkert and NFW halos, respectively. In the RC panels, the blue square with error bars represents the observed data, the blue solid line shows the best fit to the data, and the blue shaded area represents the 3σ error in the fit. The decomposed velocity of stars, molecular gas, atomic gas, bulge, and dark matter is represented by yellow, violet, light blue, brown, and black dotted-dashed lines, respectively. The vertical orange line shows the effective radius and the gray shaded area represents the unresolved region of the RC. The best-fit value of parameter space θ is given in the legend of the figures. All the parameters are printed in log, having physical units as follows: MD [M⊙], RD [kpc], Mbulge [M⊙], r0/s [kpc], and ρ0/s [gm cm−3].
Current usage metrics show cumulative count of Article Views (full-text article views including HTML views, PDF and ePub downloads, according to the available data) and Abstracts Views on Vision4Press platform.
Data correspond to usage on the plateform after 2015. The current usage metrics is available 48-96 hours after online publication and is updated daily on week days.
Initial download of the metrics may take a while.


