Fig. 1.

Download original image
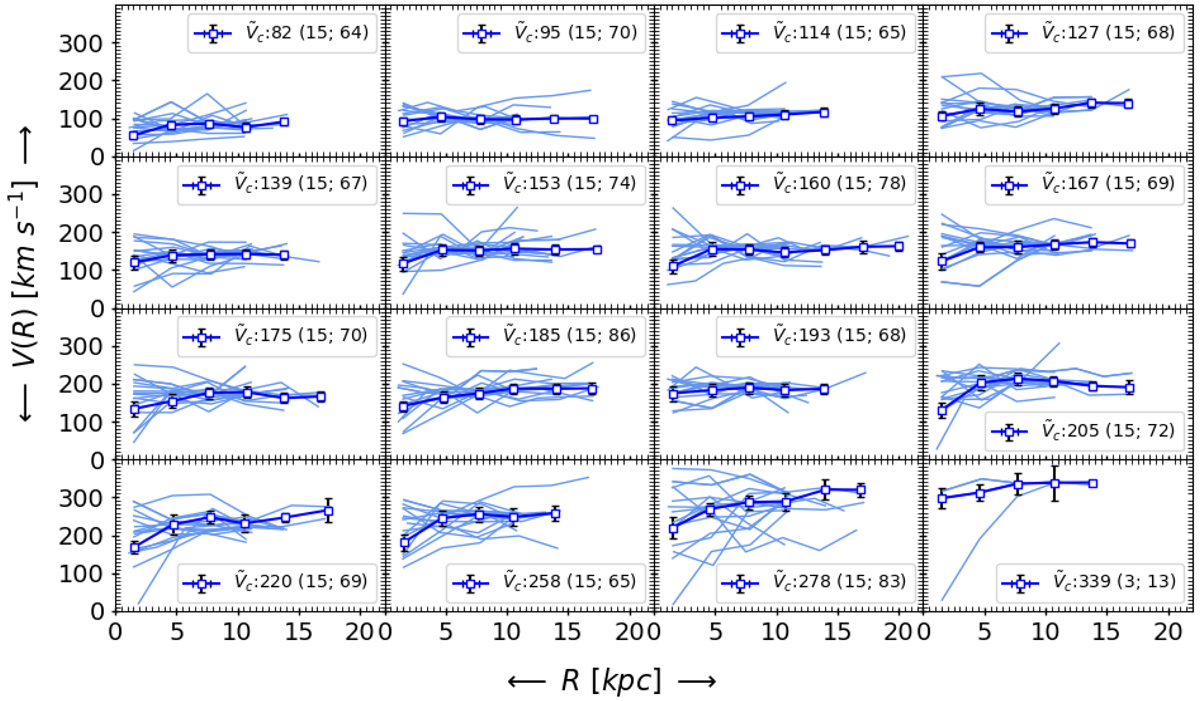
Coadded and binned rotation curves. The individual and binned RCs are shown by blue thin curves and squares connected with a dark blue line, respectively. The central velocity (![]() ) and the number of data points per bin are printed in the legend of each panel. For example, the notation
) and the number of data points per bin are printed in the legend of each panel. For example, the notation ![]() (15; 64) means that the central circular velocity of the bin is 82 km s−1 and that it contains 15 RCs and a total of 64 data-points. We note that here
(15; 64) means that the central circular velocity of the bin is 82 km s−1 and that it contains 15 RCs and a total of 64 data-points. We note that here ![]() is the circular velocity computed at
is the circular velocity computed at ![]() (=2.95 Re).
(=2.95 Re).
Current usage metrics show cumulative count of Article Views (full-text article views including HTML views, PDF and ePub downloads, according to the available data) and Abstracts Views on Vision4Press platform.
Data correspond to usage on the plateform after 2015. The current usage metrics is available 48-96 hours after online publication and is updated daily on week days.
Initial download of the metrics may take a while.


