Free Access
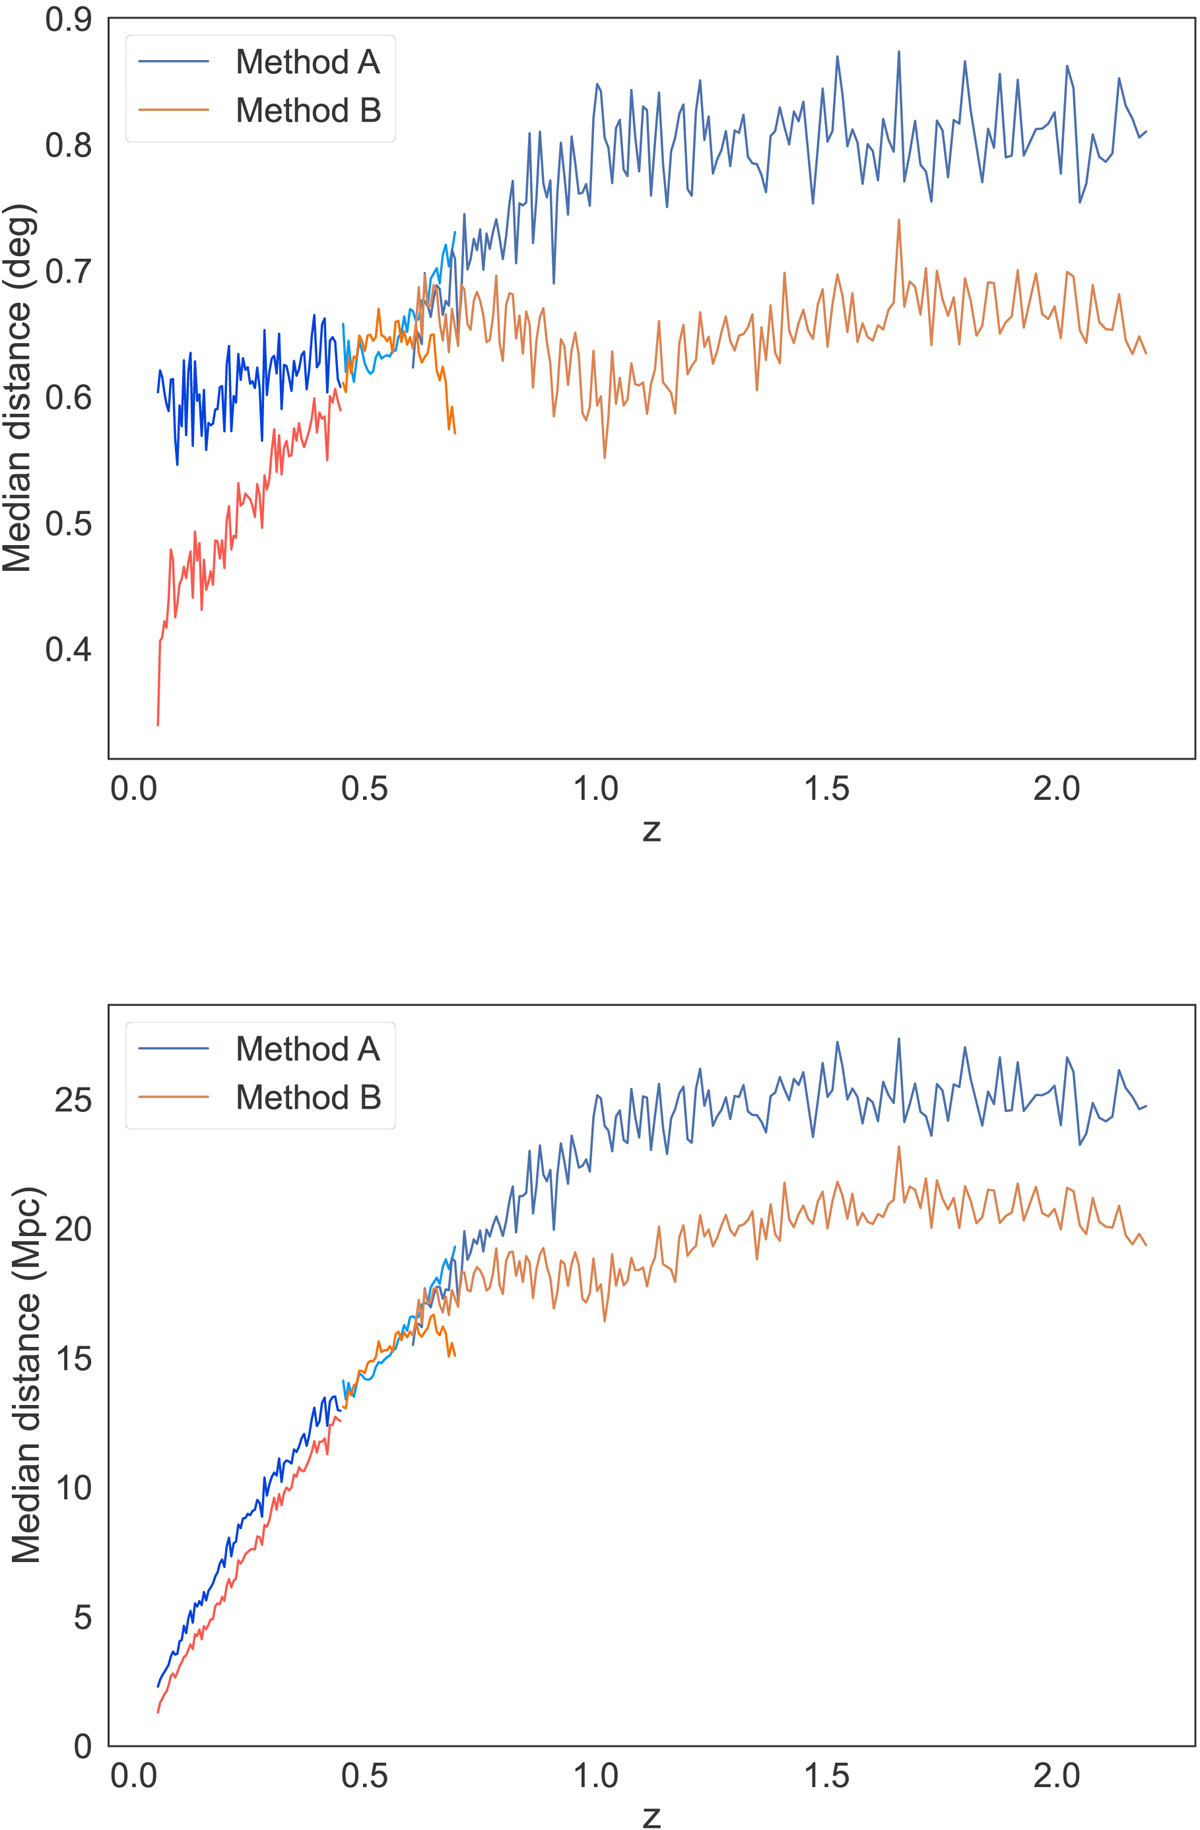
Fig. 9.
Download original image
Mean distance between galaxies and their closest filament as a function of redshift. Blue corresponds to Method A, and orange corresponds to Method B. Different shades of colour correspond to the three different Blocks with different masks. Top: angular distance in degrees; bottom: proper distance in megaparsecs.
Current usage metrics show cumulative count of Article Views (full-text article views including HTML views, PDF and ePub downloads, according to the available data) and Abstracts Views on Vision4Press platform.
Data correspond to usage on the plateform after 2015. The current usage metrics is available 48-96 hours after online publication and is updated daily on week days.
Initial download of the metrics may take a while.