Fig. 8.
Download original image
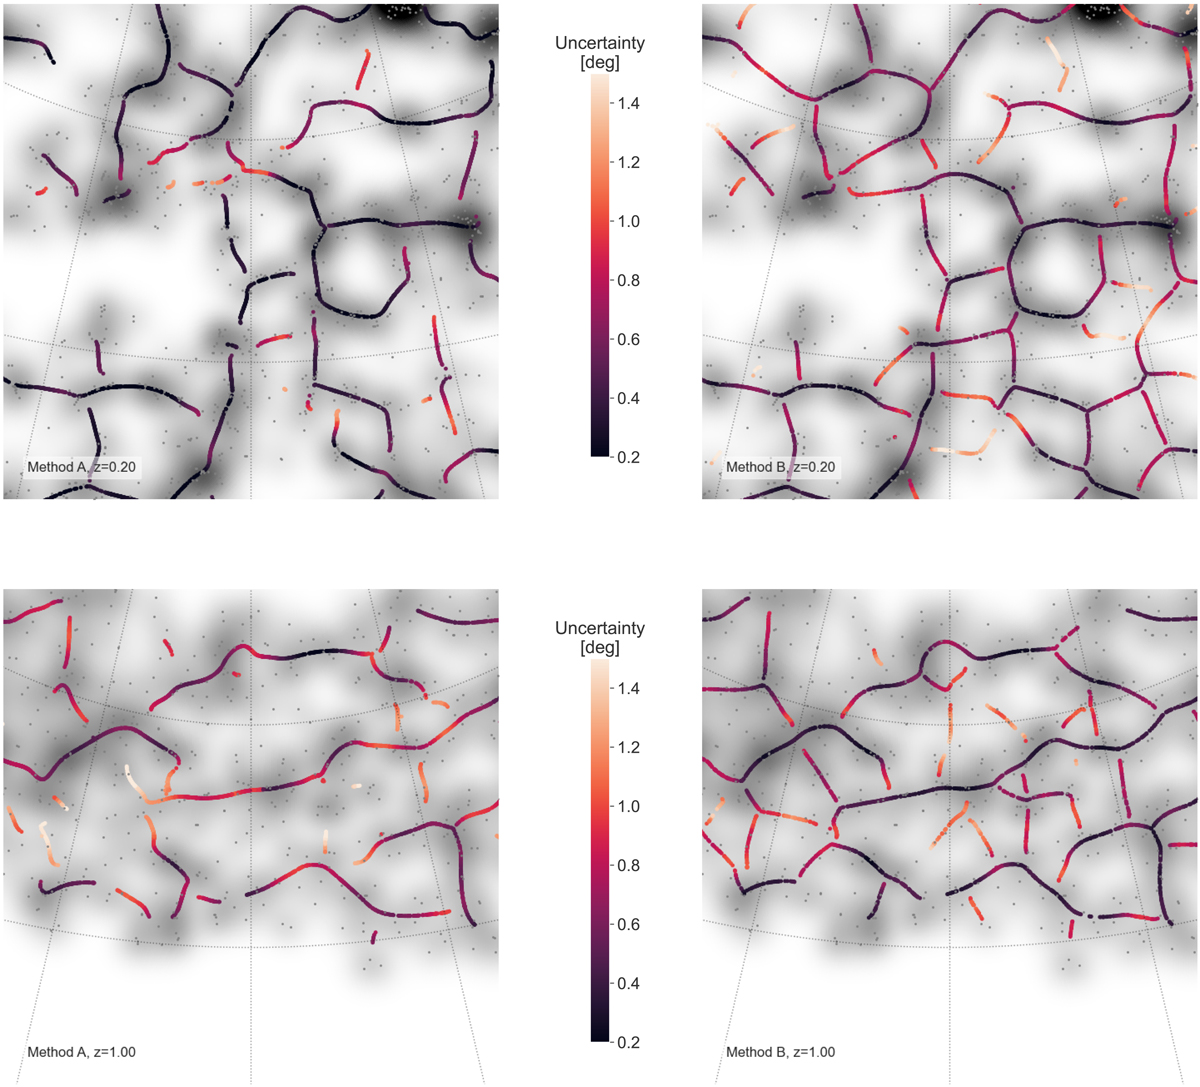
Example of reconstructed filaments at z = 0.20 (top) and z = 1.00 (bottom); with Method A (left) and Method B (right). The colour of the points represents the error estimate in degrees. Grey points correspond to galaxies, while the background map represents the galaxy density, smoothed at 3°, for visualisation purposes. The visualisation is a gnomonic projection around the point (RA = 140°, δ = 40°) with a side size of 60°. Meridians and parallels are both represented at a step of 20 deg.
Current usage metrics show cumulative count of Article Views (full-text article views including HTML views, PDF and ePub downloads, according to the available data) and Abstracts Views on Vision4Press platform.
Data correspond to usage on the plateform after 2015. The current usage metrics is available 48-96 hours after online publication and is updated daily on week days.
Initial download of the metrics may take a while.