Fig. 2.
Download original image
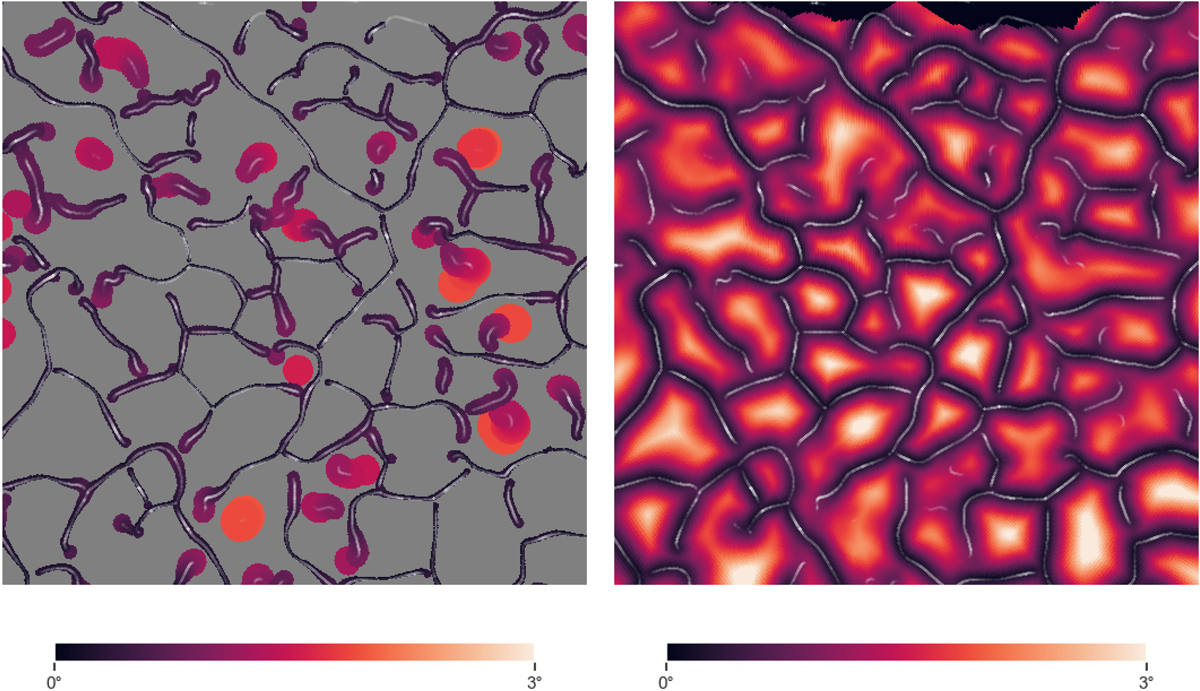
Representations of the uncertainty of the detection. On the left, we plot a circle around each point of the filament with a radius equal to the uncertainty; this is a way of visualising the regions of the sky where a certain filament is expected to be. On the right, we apply the uncertainty estimate to each pixel of the map, and obtain an average distance to bootstrapped filaments for every pixel; actual filaments are found mostly where the mean distances are low. In both cases, colour represents uncertainty in degrees, and filaments found with real data are represented in white. Both figures are gnomic projections centred at RA = 180°, Dec = 40° with a side size of 60°. The data used in this example correspond to BOSS data z = 0.570 (see Sect. 3).
Current usage metrics show cumulative count of Article Views (full-text article views including HTML views, PDF and ePub downloads, according to the available data) and Abstracts Views on Vision4Press platform.
Data correspond to usage on the plateform after 2015. The current usage metrics is available 48-96 hours after online publication and is updated daily on week days.
Initial download of the metrics may take a while.