Free Access
Fig. 18.
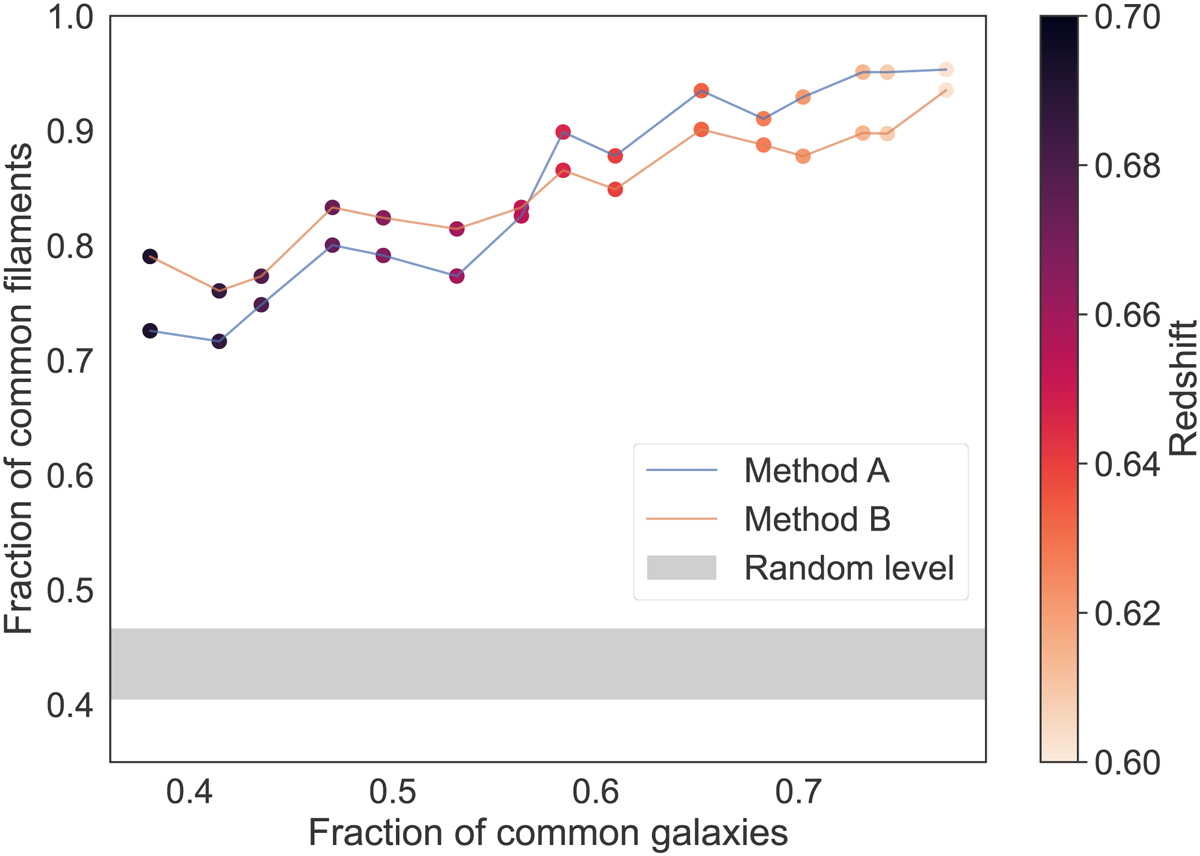
Download original image
Stability of the results to new data. On the y-axis, the fraction of filaments found using all data (older and newer) which were also found using only older data. On the x-axis, the fraction of galaxies corresponding to older data. Each point corresponds to the result for a single redshift slice. See text.
Current usage metrics show cumulative count of Article Views (full-text article views including HTML views, PDF and ePub downloads, according to the available data) and Abstracts Views on Vision4Press platform.
Data correspond to usage on the plateform after 2015. The current usage metrics is available 48-96 hours after online publication and is updated daily on week days.
Initial download of the metrics may take a while.