Fig. 16.
Download original image
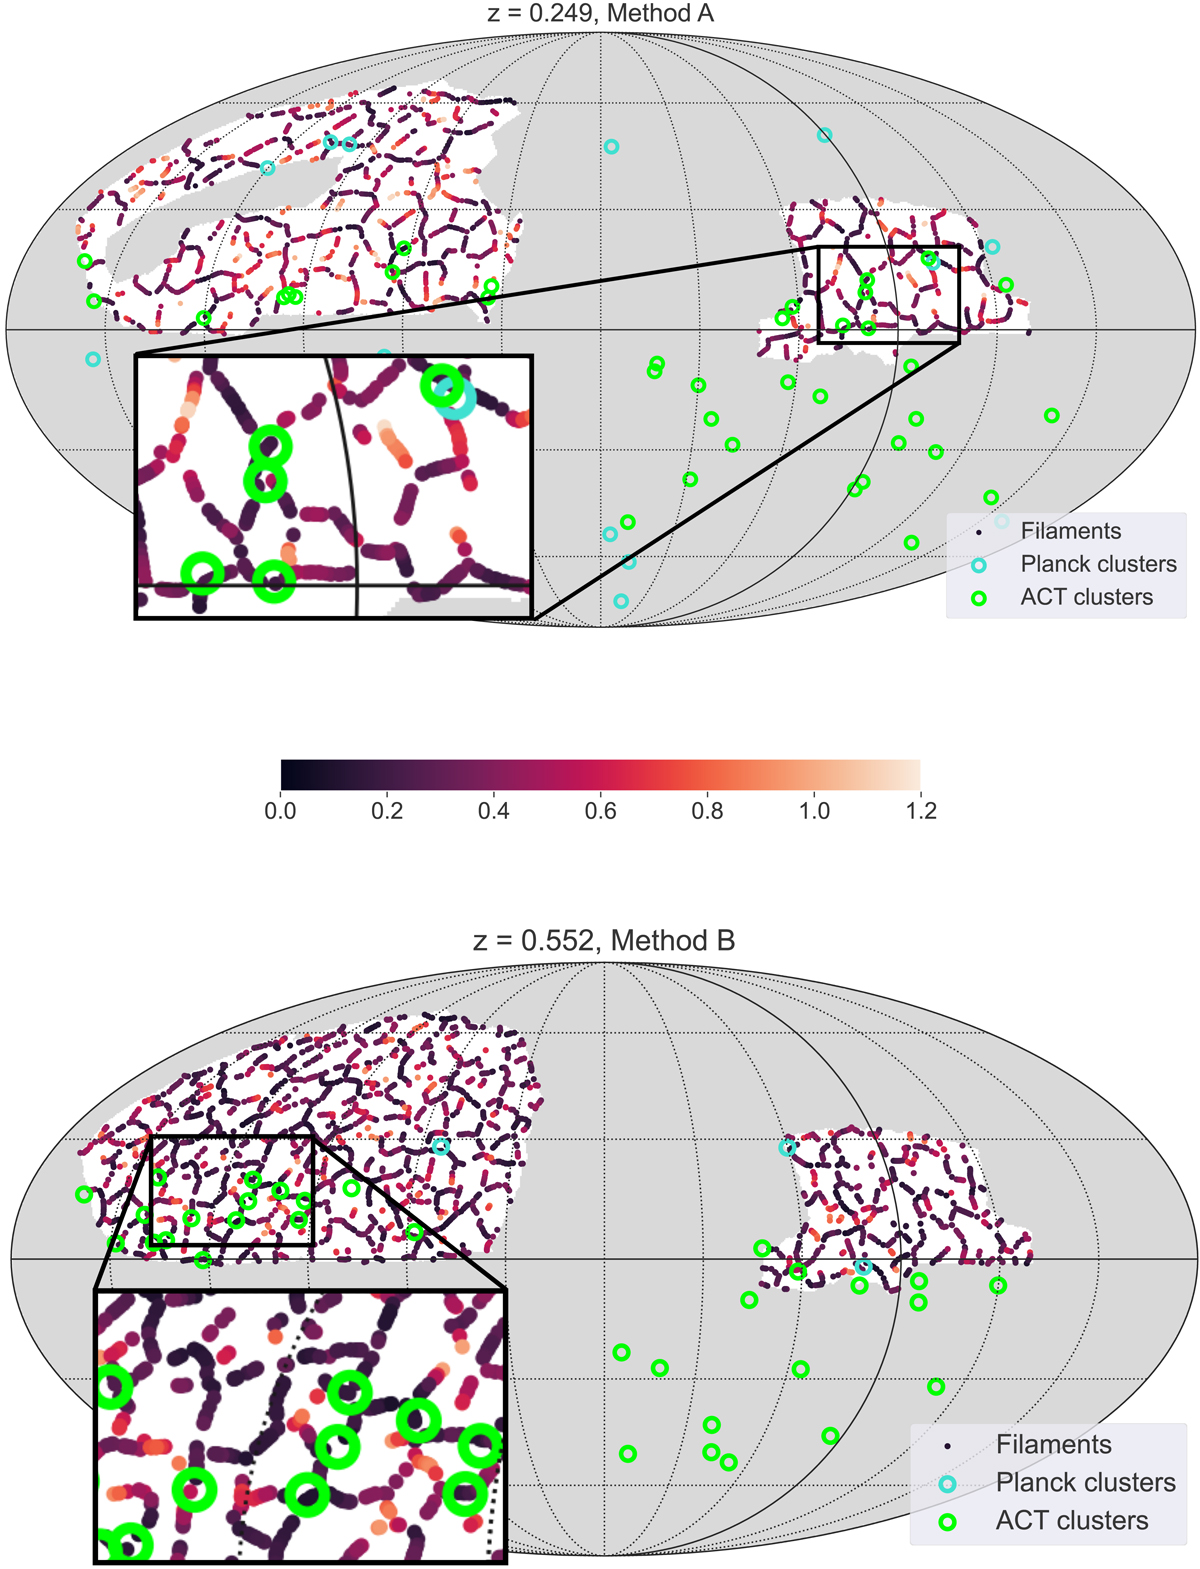
Example of filament maps at different redshift slices with the two methods. The colours of the filaments represent the estimated uncertainty of the detection, in degrees. Independently-measured galaxy clusters from Planck and ACT are also represented. The grey area is excluded from the catalogue due to lack of data and border effects.
Current usage metrics show cumulative count of Article Views (full-text article views including HTML views, PDF and ePub downloads, according to the available data) and Abstracts Views on Vision4Press platform.
Data correspond to usage on the plateform after 2015. The current usage metrics is available 48-96 hours after online publication and is updated daily on week days.
Initial download of the metrics may take a while.