Free Access
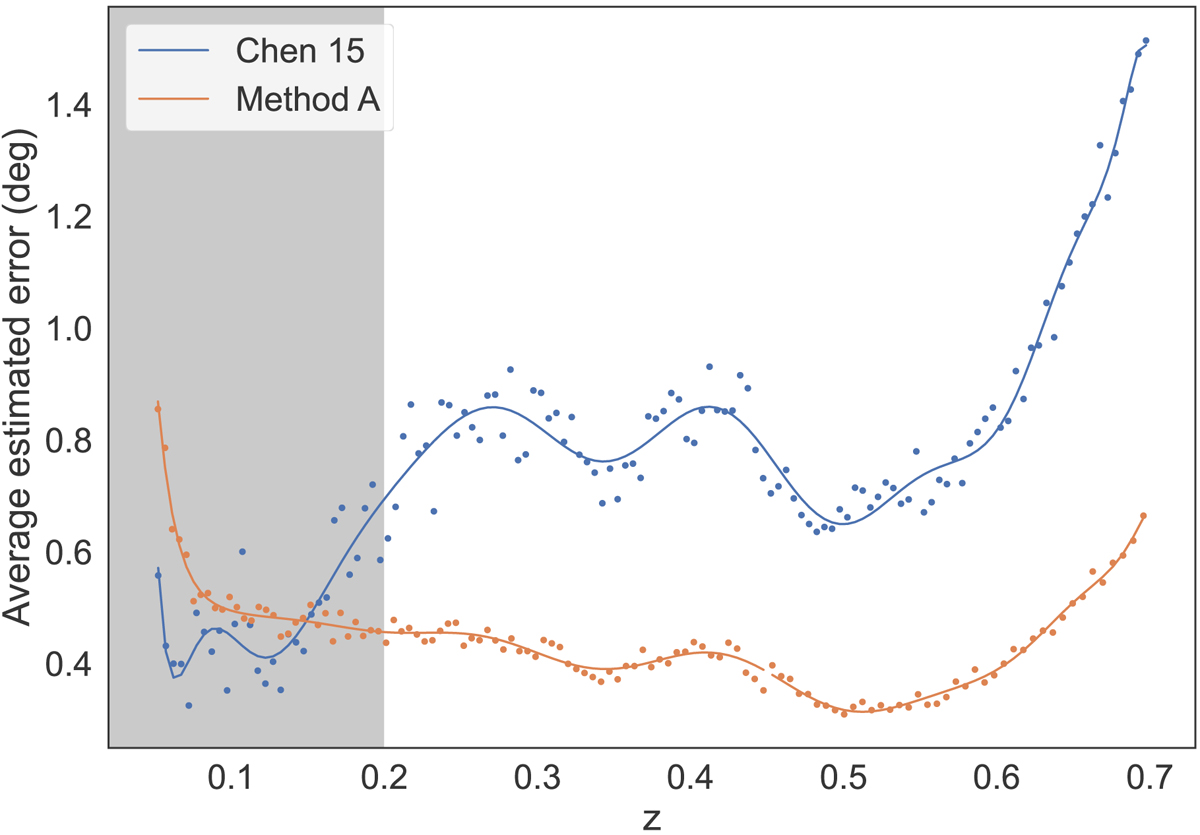
Fig. 12.
Download original image
Average estimated uncertainty of the detected filaments as a function of redshift. Orange corresponds to our Method A, blue corresponds to C15. For z < 0.2 (grey band), filaments are reconstructed from different data in the two catalogues. Lines are non-linear fits shown for visualisation only.
Current usage metrics show cumulative count of Article Views (full-text article views including HTML views, PDF and ePub downloads, according to the available data) and Abstracts Views on Vision4Press platform.
Data correspond to usage on the plateform after 2015. The current usage metrics is available 48-96 hours after online publication and is updated daily on week days.
Initial download of the metrics may take a while.