Fig. 1.
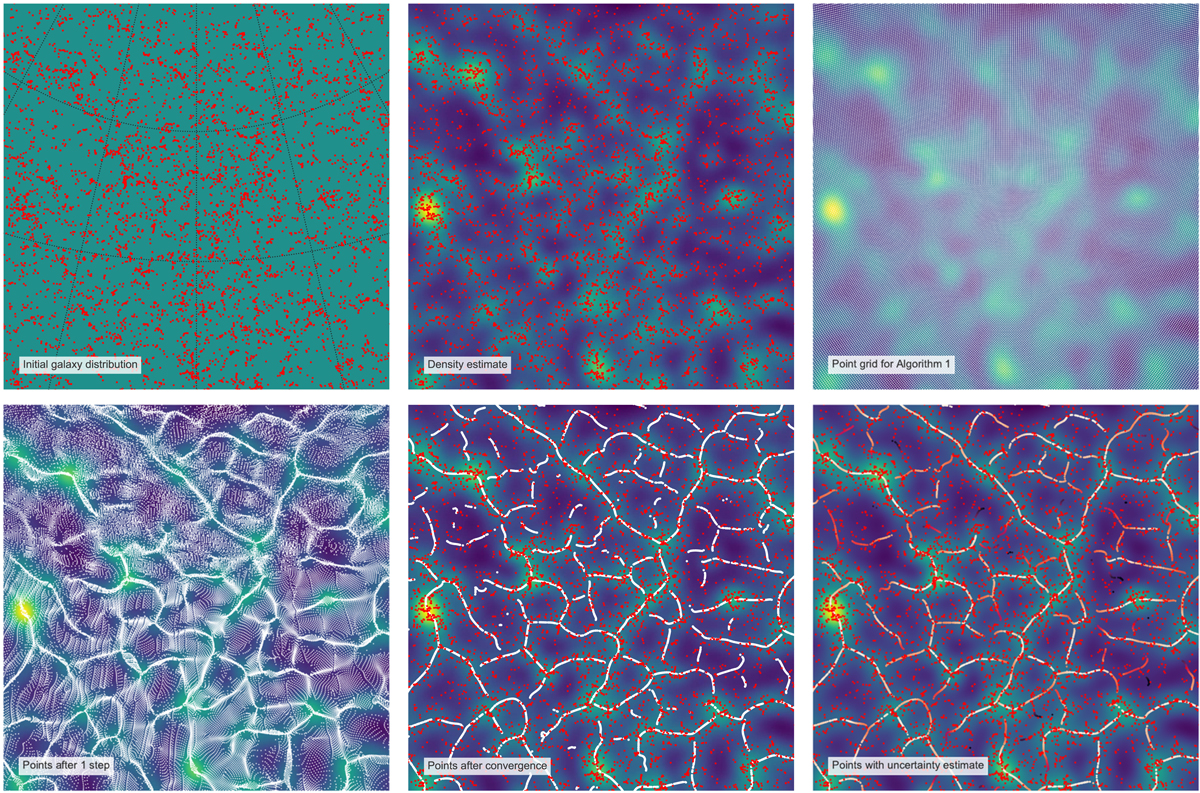
Download original image
Different steps of the algorithms. Top left: initial distribution of galaxies in a redshift slice. Top centre: a density distribution is estimated from the galaxies. Top right: a grid of points {yj} is selected as the initial positions of the iterative steps; they correspond to the centres of HEALPix pixels. Bottom left: the positions of the points after one step of the iteration. Bottom centre: the positions of the points after they converge, with the initial galaxy distribution overlapped. Bottom right: same as bottom centre, but the uncertainty of each point in the filaments is calculated with Algorithm 2; a redder colour represents a lower certainty. All images are gnomic projections centred at RA = 180°, Dec = 40° with a side size of 60°. The data used in this example corresponds to BOSS data at z = 0.570 (see Sect. 3).
Current usage metrics show cumulative count of Article Views (full-text article views including HTML views, PDF and ePub downloads, according to the available data) and Abstracts Views on Vision4Press platform.
Data correspond to usage on the plateform after 2015. The current usage metrics is available 48-96 hours after online publication and is updated daily on week days.
Initial download of the metrics may take a while.