Fig. B.1
Download original image
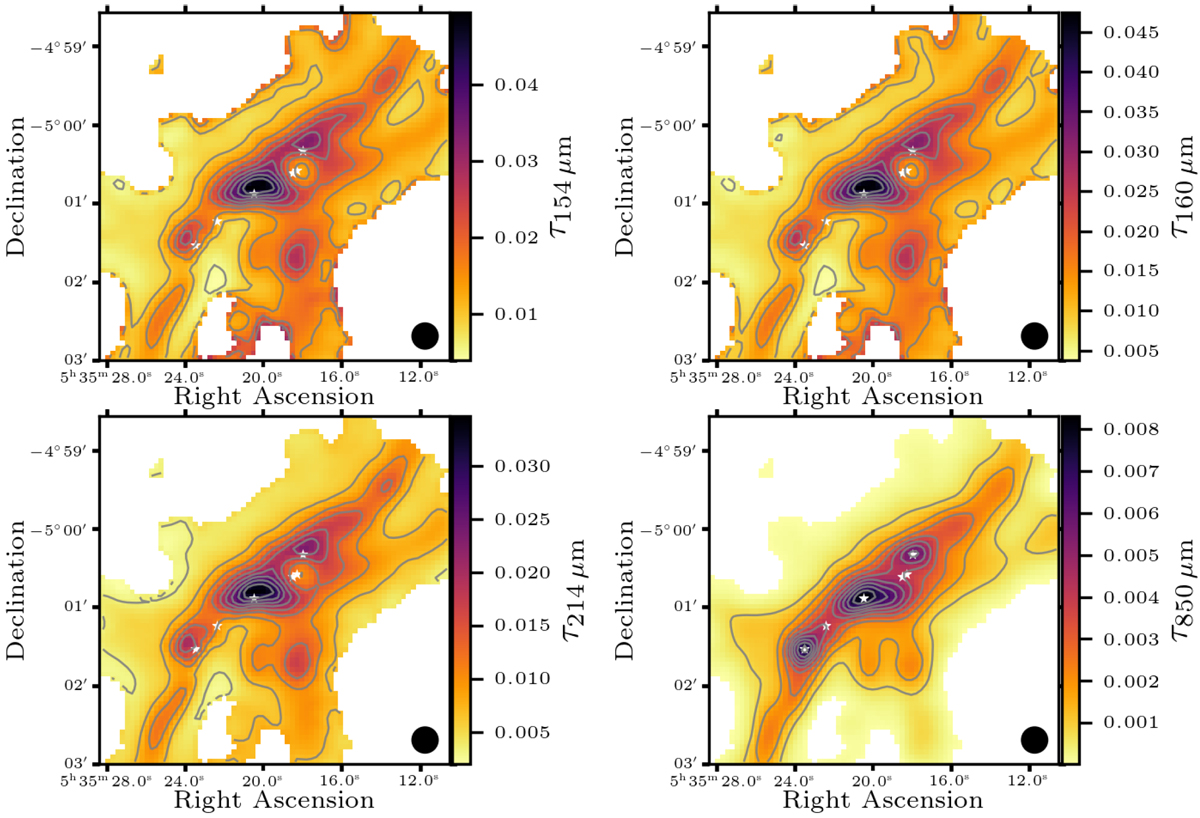
Maps of optical depth at wavelengths of 154 μm (top left), 160 μm (top right), 214 μm (bottom left), and 850 μm (bottom right). The contour lines mark 10, 20, 30, 40, 50, 60, 70, 80, and 90 % of the maximum optical depth for each wavelength. The white asterisk symbols mark known stellar sources (Chini et al. 1997). The beam size of 18.2″ (band E) is indicated on the lower-right of each figure.
Current usage metrics show cumulative count of Article Views (full-text article views including HTML views, PDF and ePub downloads, according to the available data) and Abstracts Views on Vision4Press platform.
Data correspond to usage on the plateform after 2015. The current usage metrics is available 48-96 hours after online publication and is updated daily on week days.
Initial download of the metrics may take a while.