Fig. 11
Download original image
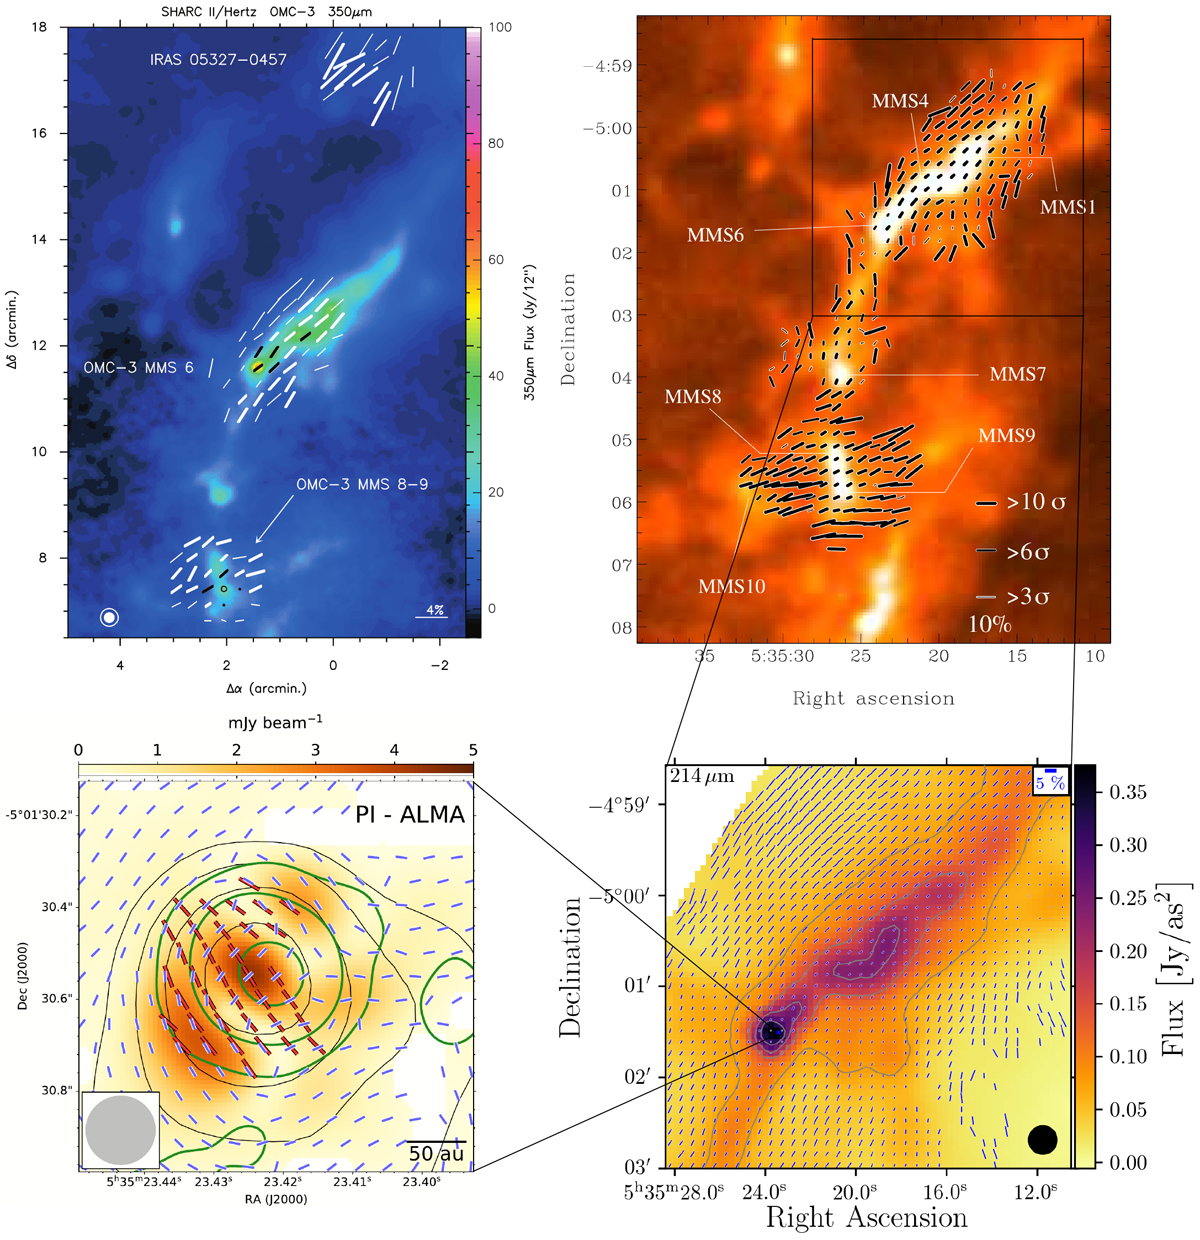
Multiwavelength, multiscale polarization maps of OMC-3. Top left: intensity and polarization map obtained with SHARC II and Hertz at 350 μm, respectively. Overlaid are polarization vectors in white and black (Houde et al. 2004, ©AAS. Reproduced with permission). Top right: total intensity, observed at 850 μm with SCUBA, is shown with overlaid polarization vectors in blue (Matthews et al. 2001, ©AAS. Reproduced with permission). Bottom left: total intensity, observed at 1.2 mm with ALMA, is shown with overlaid polarization vectors in blue. Red polarization vectors are oberserved with JVLA at 9 mm (Liu 2021, ©AAS. Reproduced with permission). Bottom right: Total intensity, observed at 214 μm with SOFIA/HAWC+, is shown with overlaid polarization vectors in blue.
Current usage metrics show cumulative count of Article Views (full-text article views including HTML views, PDF and ePub downloads, according to the available data) and Abstracts Views on Vision4Press platform.
Data correspond to usage on the plateform after 2015. The current usage metrics is available 48-96 hours after online publication and is updated daily on week days.
Initial download of the metrics may take a while.