Fig. 1
Download original image
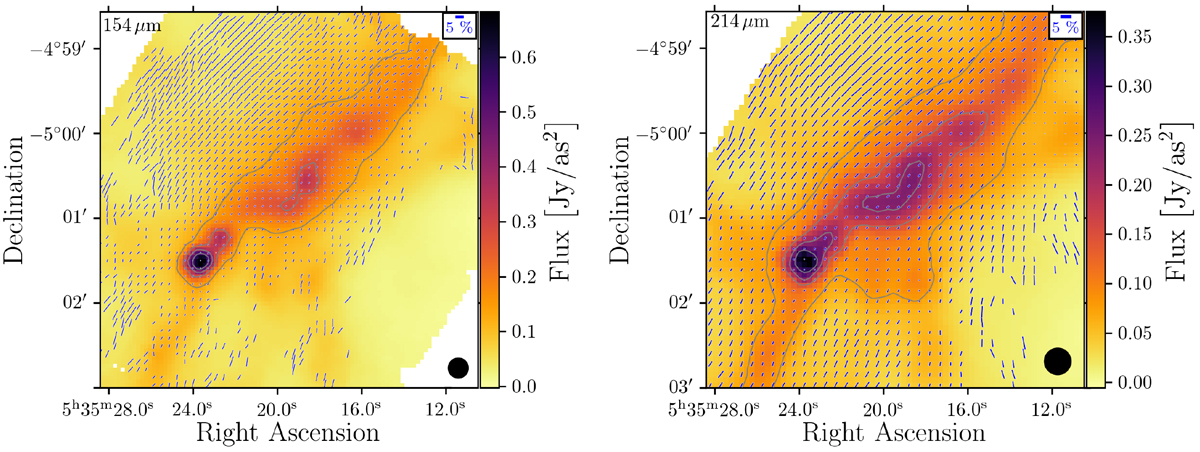
SOFIA/HAWC+ band D (154 μm, left) and E (214 μm, right) polarization maps of OMC-3. The total intensity is shown with overlaid polarization vectors in blue. The length of the vectors is proportional to the polarization degree and the direction gives the orientation of the linear polarization. The isocontour lines mark 20, 40, 60, and 80% of the maximum intensity. According to criteria Eqs. (2) and (3), only vectors with I > 100 σI and p > 3 σp ought to be considered (see Sect. 2). The beam sizes of 13.6″ for 154 μm and 18.2″ for 214 μm (defined by the FWHM) are indicated in the lower right corners of their corresponding plots.
Current usage metrics show cumulative count of Article Views (full-text article views including HTML views, PDF and ePub downloads, according to the available data) and Abstracts Views on Vision4Press platform.
Data correspond to usage on the plateform after 2015. The current usage metrics is available 48-96 hours after online publication and is updated daily on week days.
Initial download of the metrics may take a while.