Fig. 6.
Download original image
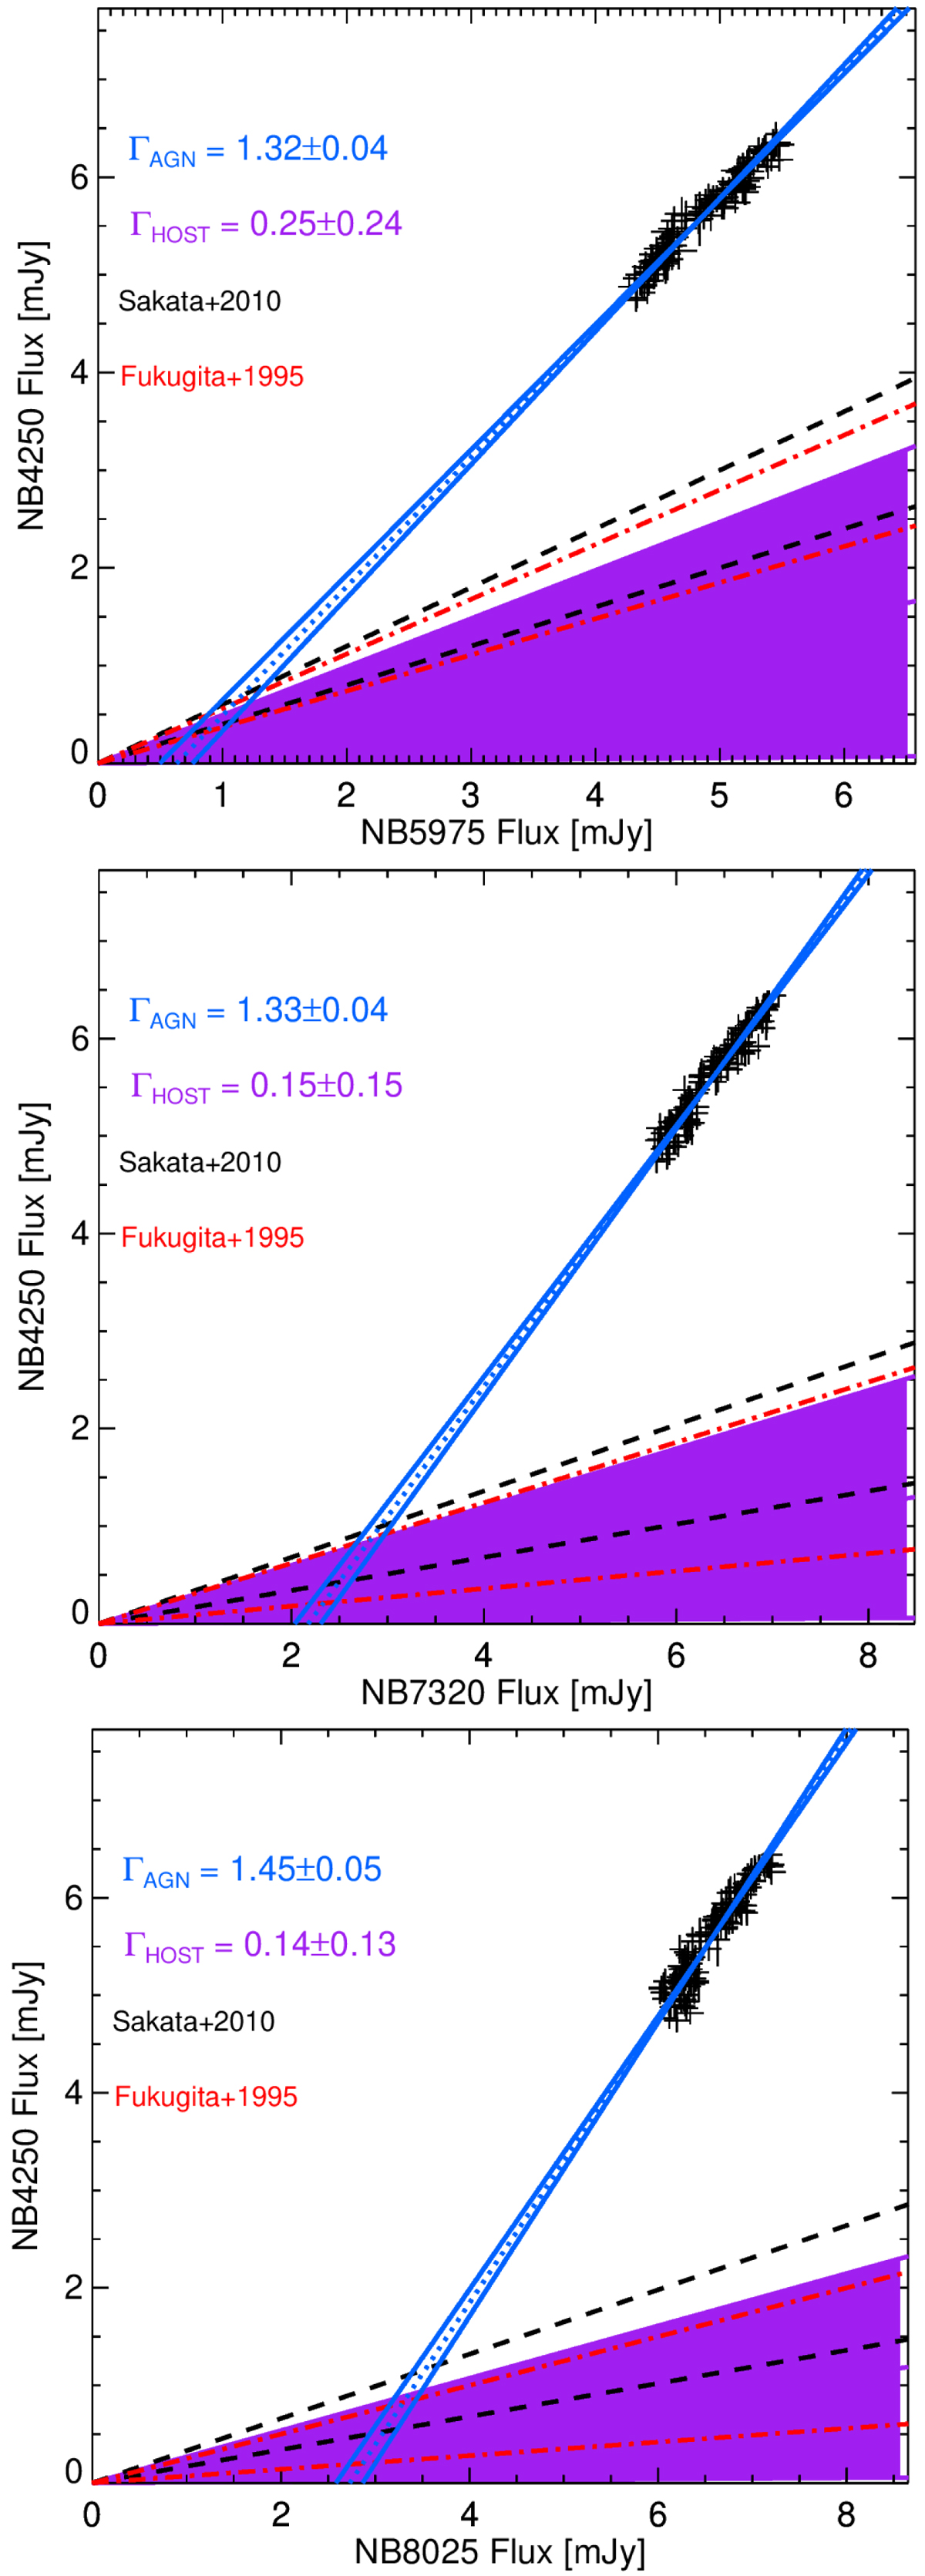
FVG diagram of PG 2130+099 between NB4250 and NB5975 (top), NB4250 and NB7320 (middle), and NB4250 and NB8025 (bottom). Each data point is drawn as a thin cross in which the line length corresponds to the photometric uncertainties in the respective filters. A linear least-squares fit to the data points yields the ±1σ range for the AGN slope, plotted by the two steep blue lines. The magenta shaded area denotes the host color range from our multi-aperture photometry. The dashed lines indicate the range of the interpolated host slopes determined by Sakata et al. (2010) (black) and by Fukugita et al. (1995) (red). The intersection between the AGN and the host galaxy slope gives the host contribution in the respective band within the aperture.
Current usage metrics show cumulative count of Article Views (full-text article views including HTML views, PDF and ePub downloads, according to the available data) and Abstracts Views on Vision4Press platform.
Data correspond to usage on the plateform after 2015. The current usage metrics is available 48-96 hours after online publication and is updated daily on week days.
Initial download of the metrics may take a while.