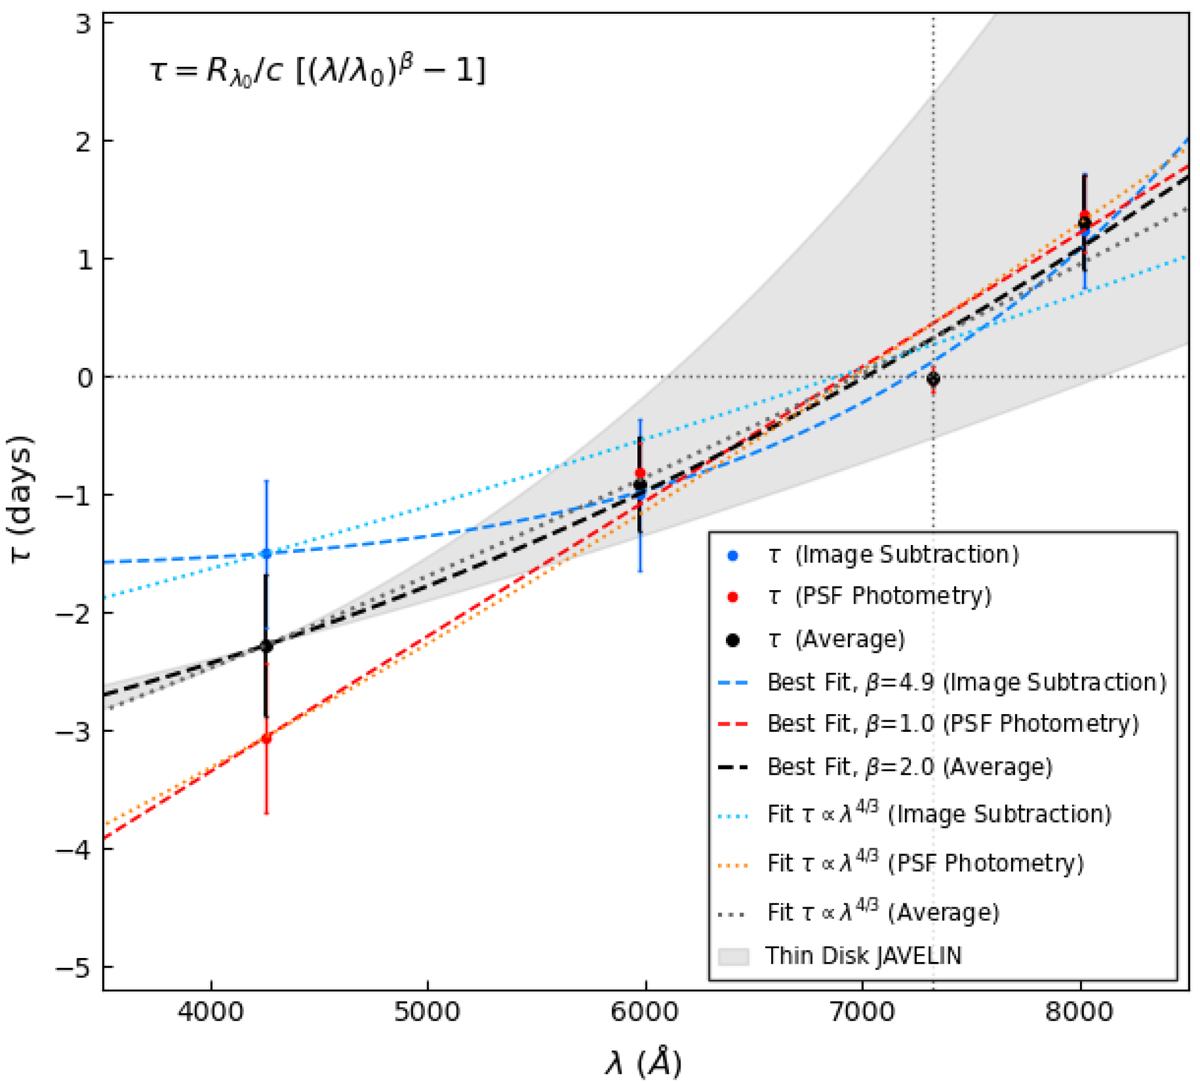
Fig. 5.
Download original image
PSF photometry (red), proper image subtraction (blue), and mean (black) time lags as a function of wavelength. All lags are measured with respect to the 7320 Å band. The dashed lines show the best fit to the observed relation τ = Rλ0/c [(λ/λ0)β − 1] with Rλ0/c and β as free parameters. The dotted lines are fits with fixed theoretical power-law index β = 4/3, as expected for an optically thick and geometrically thin disk. The shaded envelope shows the results of the JAVELIN Thin Disk inspired model.
Current usage metrics show cumulative count of Article Views (full-text article views including HTML views, PDF and ePub downloads, according to the available data) and Abstracts Views on Vision4Press platform.
Data correspond to usage on the plateform after 2015. The current usage metrics is available 48-96 hours after online publication and is updated daily on week days.
Initial download of the metrics may take a while.