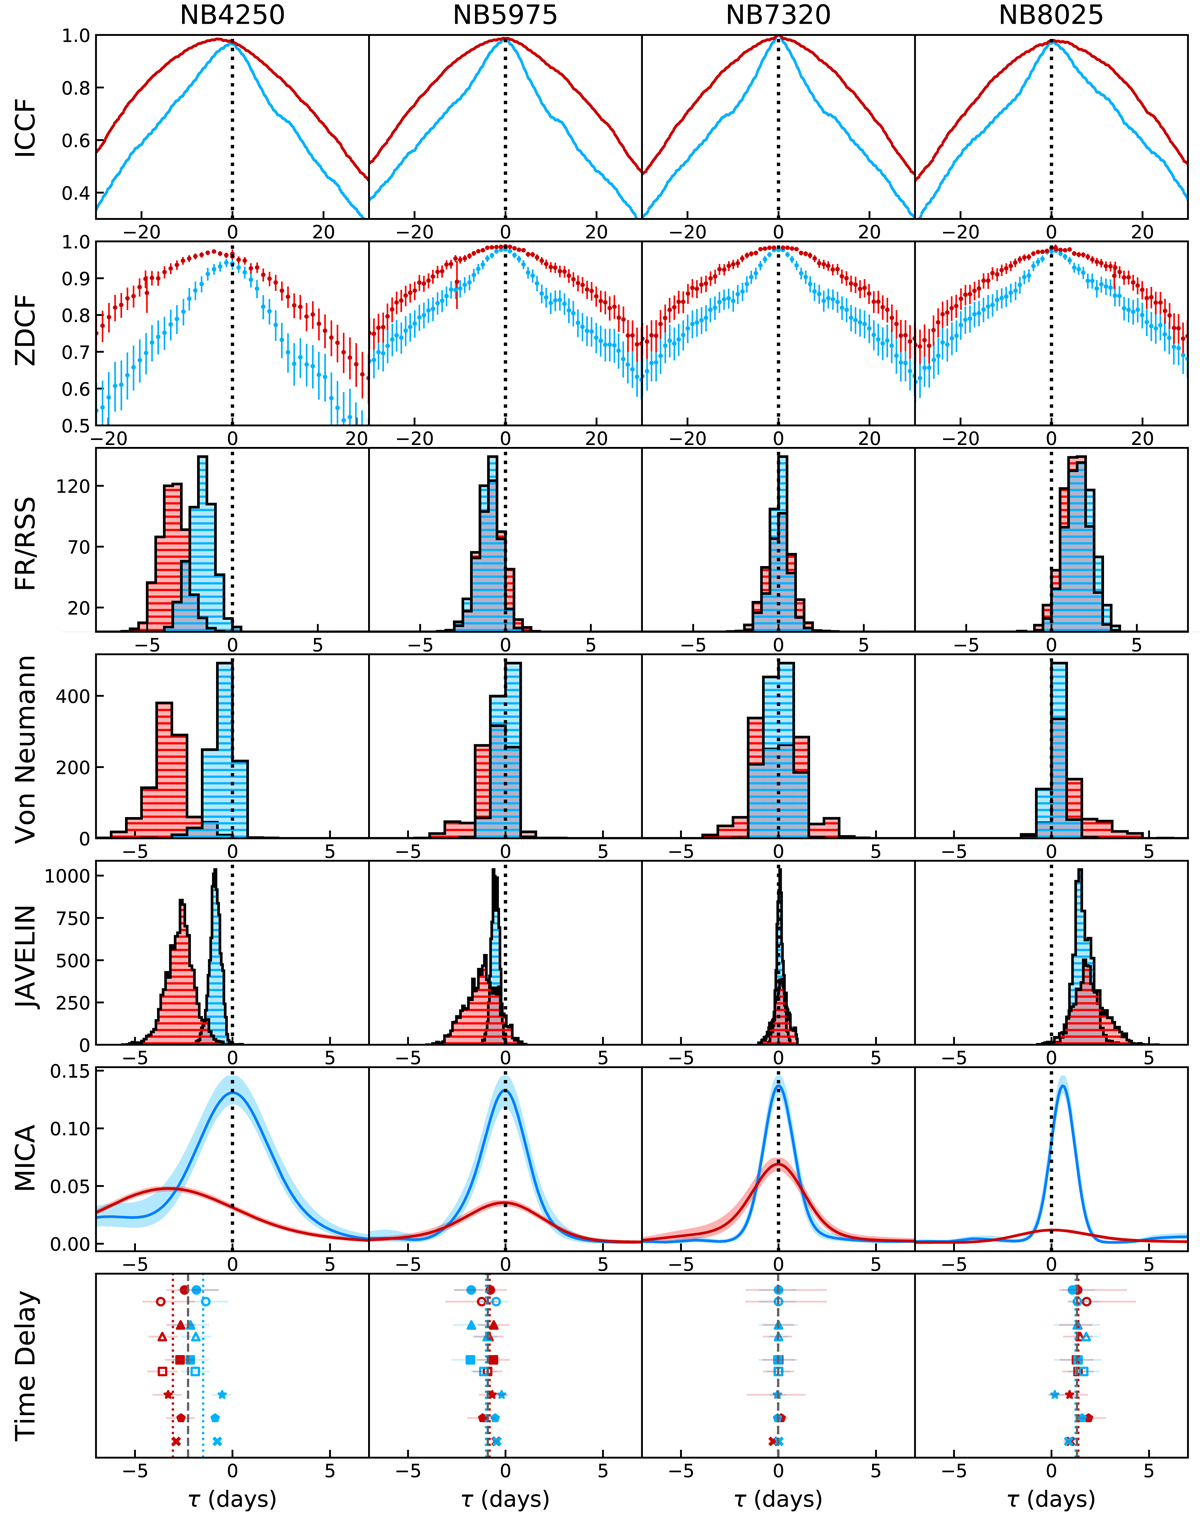
Fig. 4.
Download original image
From top to bottom: partially interpolated CCFs, z-transformed DCFs, FR/RSS centroid distributions (for centroid ≥0.8 rmax), von Neuman estimator peak distributions, JAVELIN posterior distributions of lags, and MICA transfer functions for each NB relative to the 7320 Å band. A positive value means the comparison band lags behind the NB7320 light curve. The blue distributions/functions stand for the results obtained by applying the methods to the proper image subtraction light curves while the red color corresponds to the results deduced from the PSF photometry light curves. Bottom panel: all time delays are plotted (in the same order as described before) on a vertical axis for illustration. The colored dotted lines show the mean time delay of each reduction procedure (i.e. PSF photometry and proper image subtraction) and the gray dashed line gives the mean time delay of all methods and reduction procedures together. These values are presented in Table 5.
Current usage metrics show cumulative count of Article Views (full-text article views including HTML views, PDF and ePub downloads, according to the available data) and Abstracts Views on Vision4Press platform.
Data correspond to usage on the plateform after 2015. The current usage metrics is available 48-96 hours after online publication and is updated daily on week days.
Initial download of the metrics may take a while.