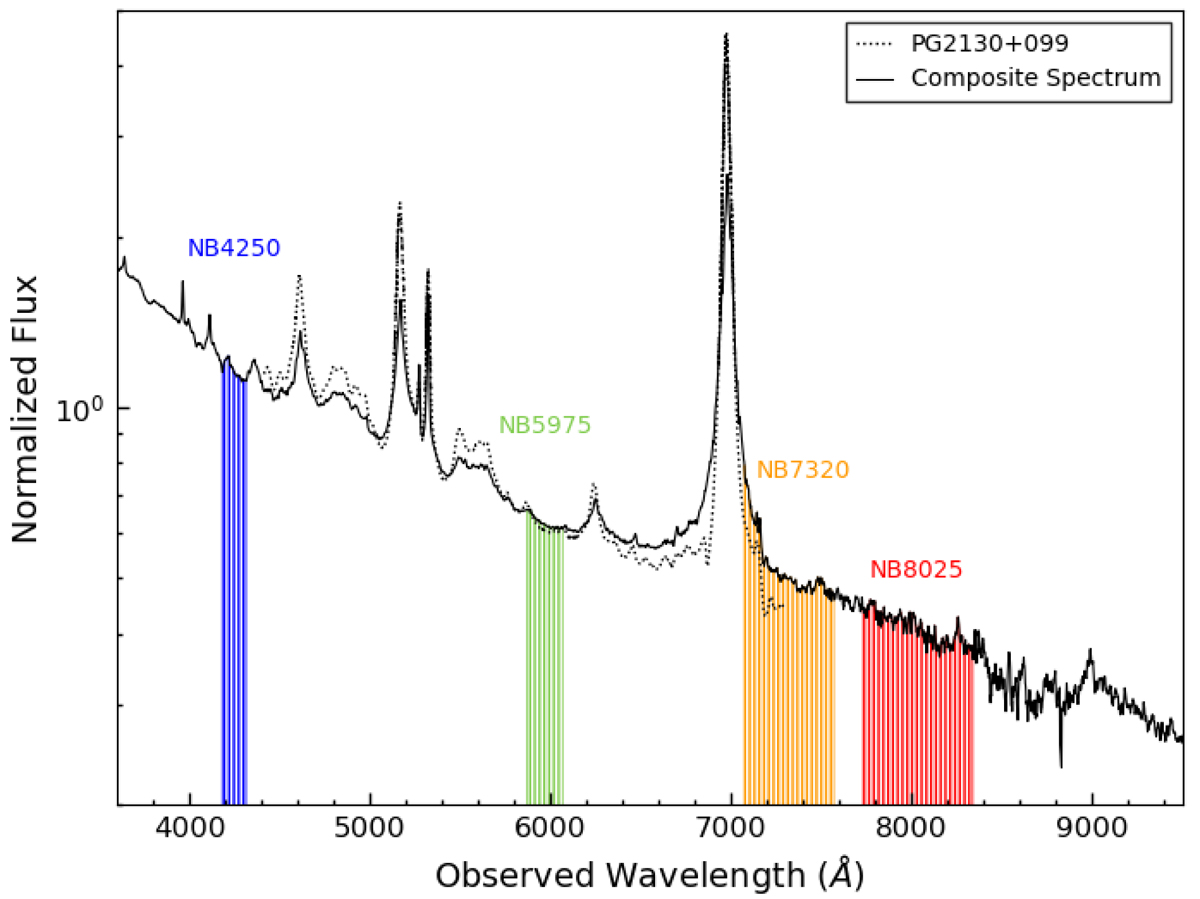
Fig. 1.
Download original image
Composite AGN spectrum of Glikman et al. (2006) (solid line; shown at the quasar’s redshift at z = 0.063), overlaid with the spectrum of PG 2130+099 obtained by Grier et al. (2008) (dotted line). The four emission-line-free NB passes of the filters which mainly trace the AGN continuum variations and are used for the photometric monitoring presented in this work, are shaded in different colors (blue for NB4250, green for NB5975, orange for NB7320, and red for NB8025).
Current usage metrics show cumulative count of Article Views (full-text article views including HTML views, PDF and ePub downloads, according to the available data) and Abstracts Views on Vision4Press platform.
Data correspond to usage on the plateform after 2015. The current usage metrics is available 48-96 hours after online publication and is updated daily on week days.
Initial download of the metrics may take a while.