Fig. 4

Download original image
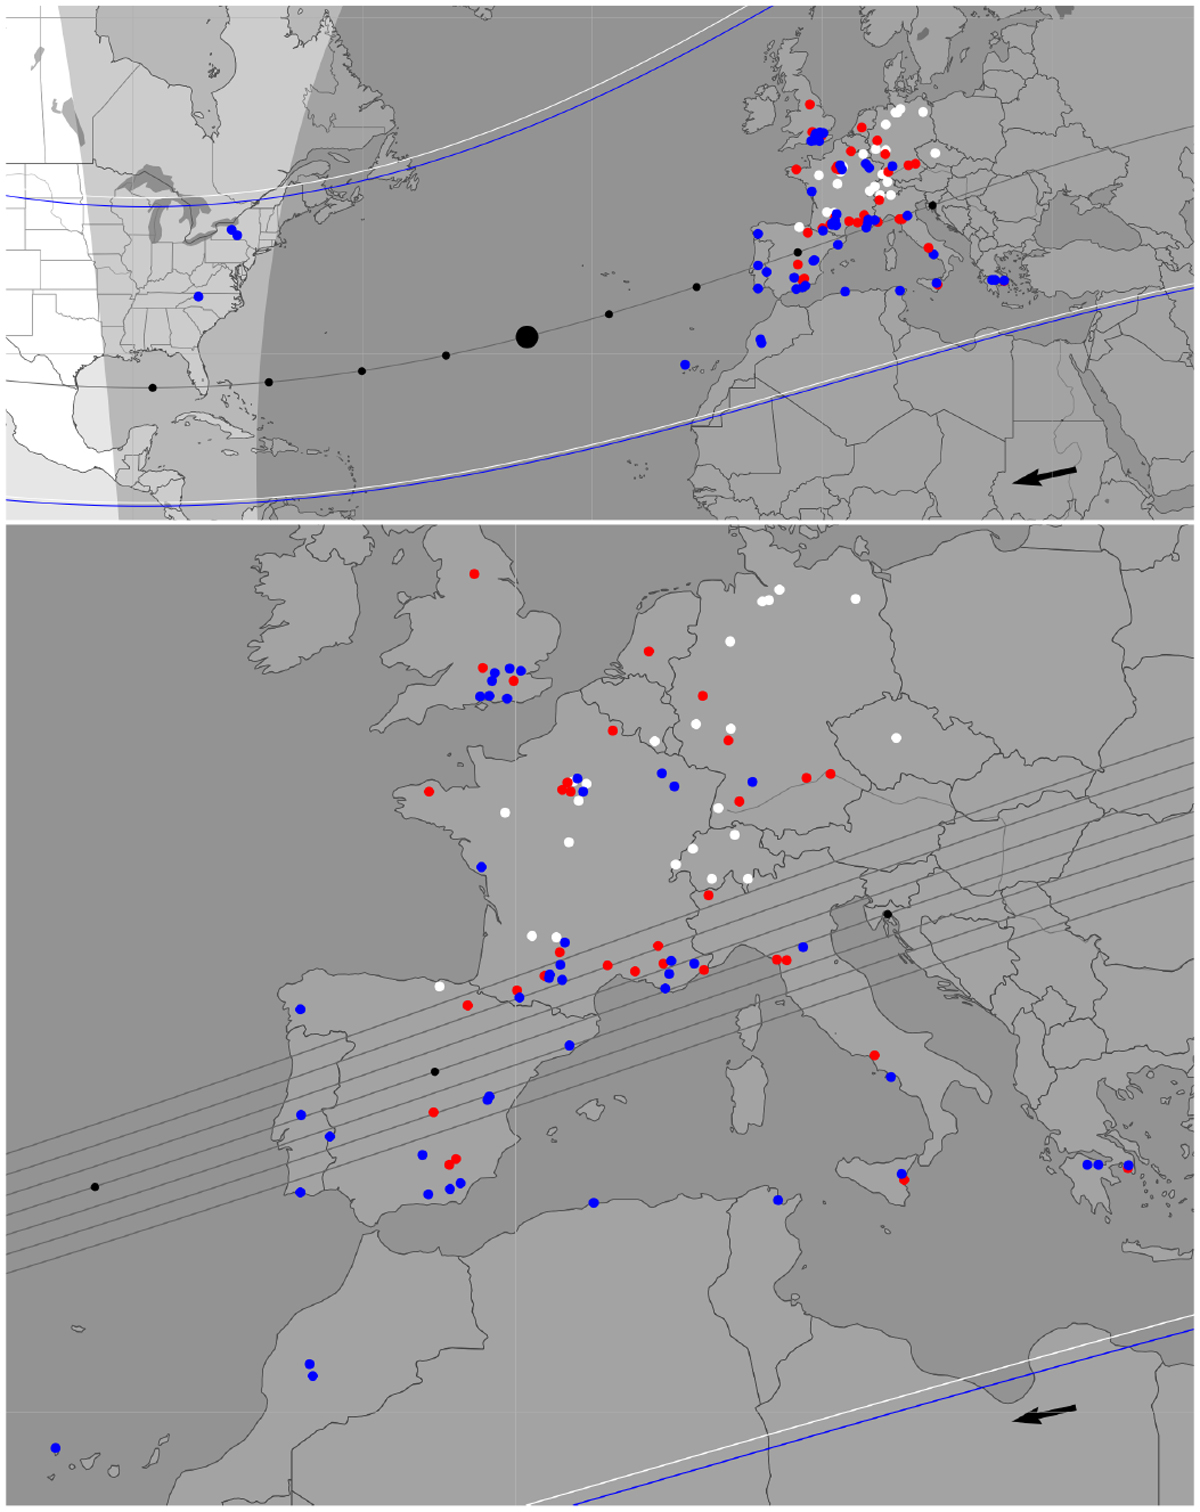
Triton’s shadow path on 5 October 2017. The black dots are spaced by one minute, the arrow indicating the direction of motion of the shadow. The northern and southern limits of the solid body assuming a radius of 1353 km are also represented, with the predicted path as the white lines and the effective path as the blue lines. The grey area represents night on Earth (dark grey for full astronomical night and light grey for twilight). Stations with a successful observation that have been used in our fit are represented by blue dots, while the ones that were not used are shown as red dots. The white dots are the stations that attempted observation but were clouded out or had technical difficulties. Upper panel: overview of all observing stations. The larger black dot along the black line corresponds to the closest approach of the shadow centre to the geocentre, at around 23h52 UTC (see Table 1). Lower panel: closer look at the central flash path across Europe. The grey lines around the centremost line correspond to a spacing of 50 km (corresponding to about 2.5 mas) once projected in the sky plane.
Current usage metrics show cumulative count of Article Views (full-text article views including HTML views, PDF and ePub downloads, according to the available data) and Abstracts Views on Vision4Press platform.
Data correspond to usage on the plateform after 2015. The current usage metrics is available 48-96 hours after online publication and is updated daily on week days.
Initial download of the metrics may take a while.


