Fig. C.1

Download original image
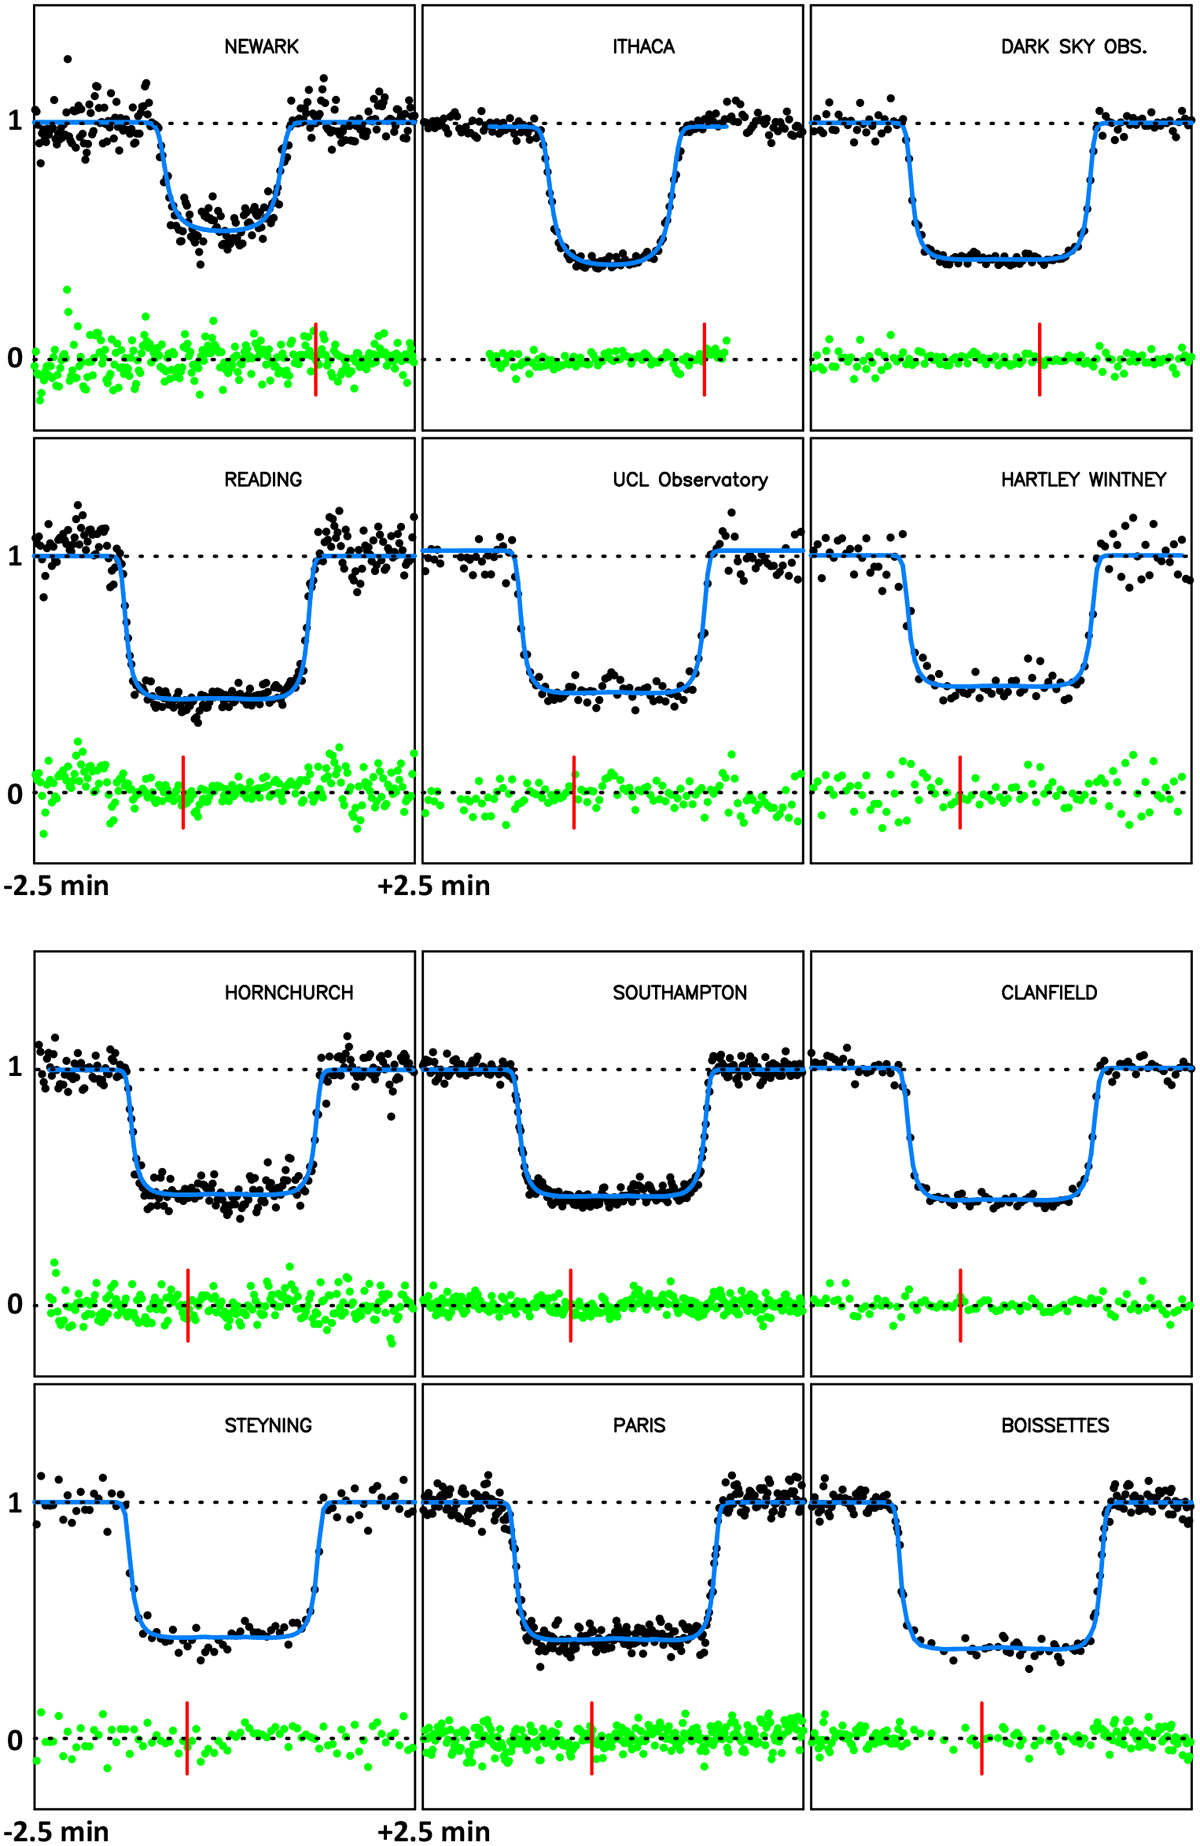
Data (black dots) fitted simultaneously with synthetic light curves (blue lines), based on the temperature profile displayed in Fig. 10 (black line) and the pressure boundary condition p1400 = 1.18 µbar (Table 4). The green dots are the residuals of the fits. We note that the central flash regions have been excluded from the fit so that we obtain a global fit that is not influenced by the deepest atmospheric layers. The stations with exposure times smaller than 1 s have been smoothed to have a sampling time close to 1 s, allowing a direct visual comparison of S/N of the various datasets. The lower and upper horizontal dotted lines mark the zero-flux level and the total star plus Triton unocculted flux, respectively. We note that the three central-most stations (Constância, Le Beausset, and Felsina observatories in Fig. C) are plotted at a different vertical scale to accommodate the presence of a strong central flash. Each panel has a duration of five minutes and is centred around the time of closest approach (or mid-occultation time) of the station to Triton’s shadow centre. The stations are sorted from left to right and top to bottom from the northernmost track (Newark) to the southernmost track (Athens; see Fig. C), projected on Triton in the sky plane (Fig. 5). For reference, the vertical red lines mark 23:48 UTC for the European and African stations, and 23:55 UTC for the US stations (Newark, Ithaca, and Dark Sky observatories).
Current usage metrics show cumulative count of Article Views (full-text article views including HTML views, PDF and ePub downloads, according to the available data) and Abstracts Views on Vision4Press platform.
Data correspond to usage on the plateform after 2015. The current usage metrics is available 48-96 hours after online publication and is updated daily on week days.
Initial download of the metrics may take a while.


