Fig. B.2

Download original image
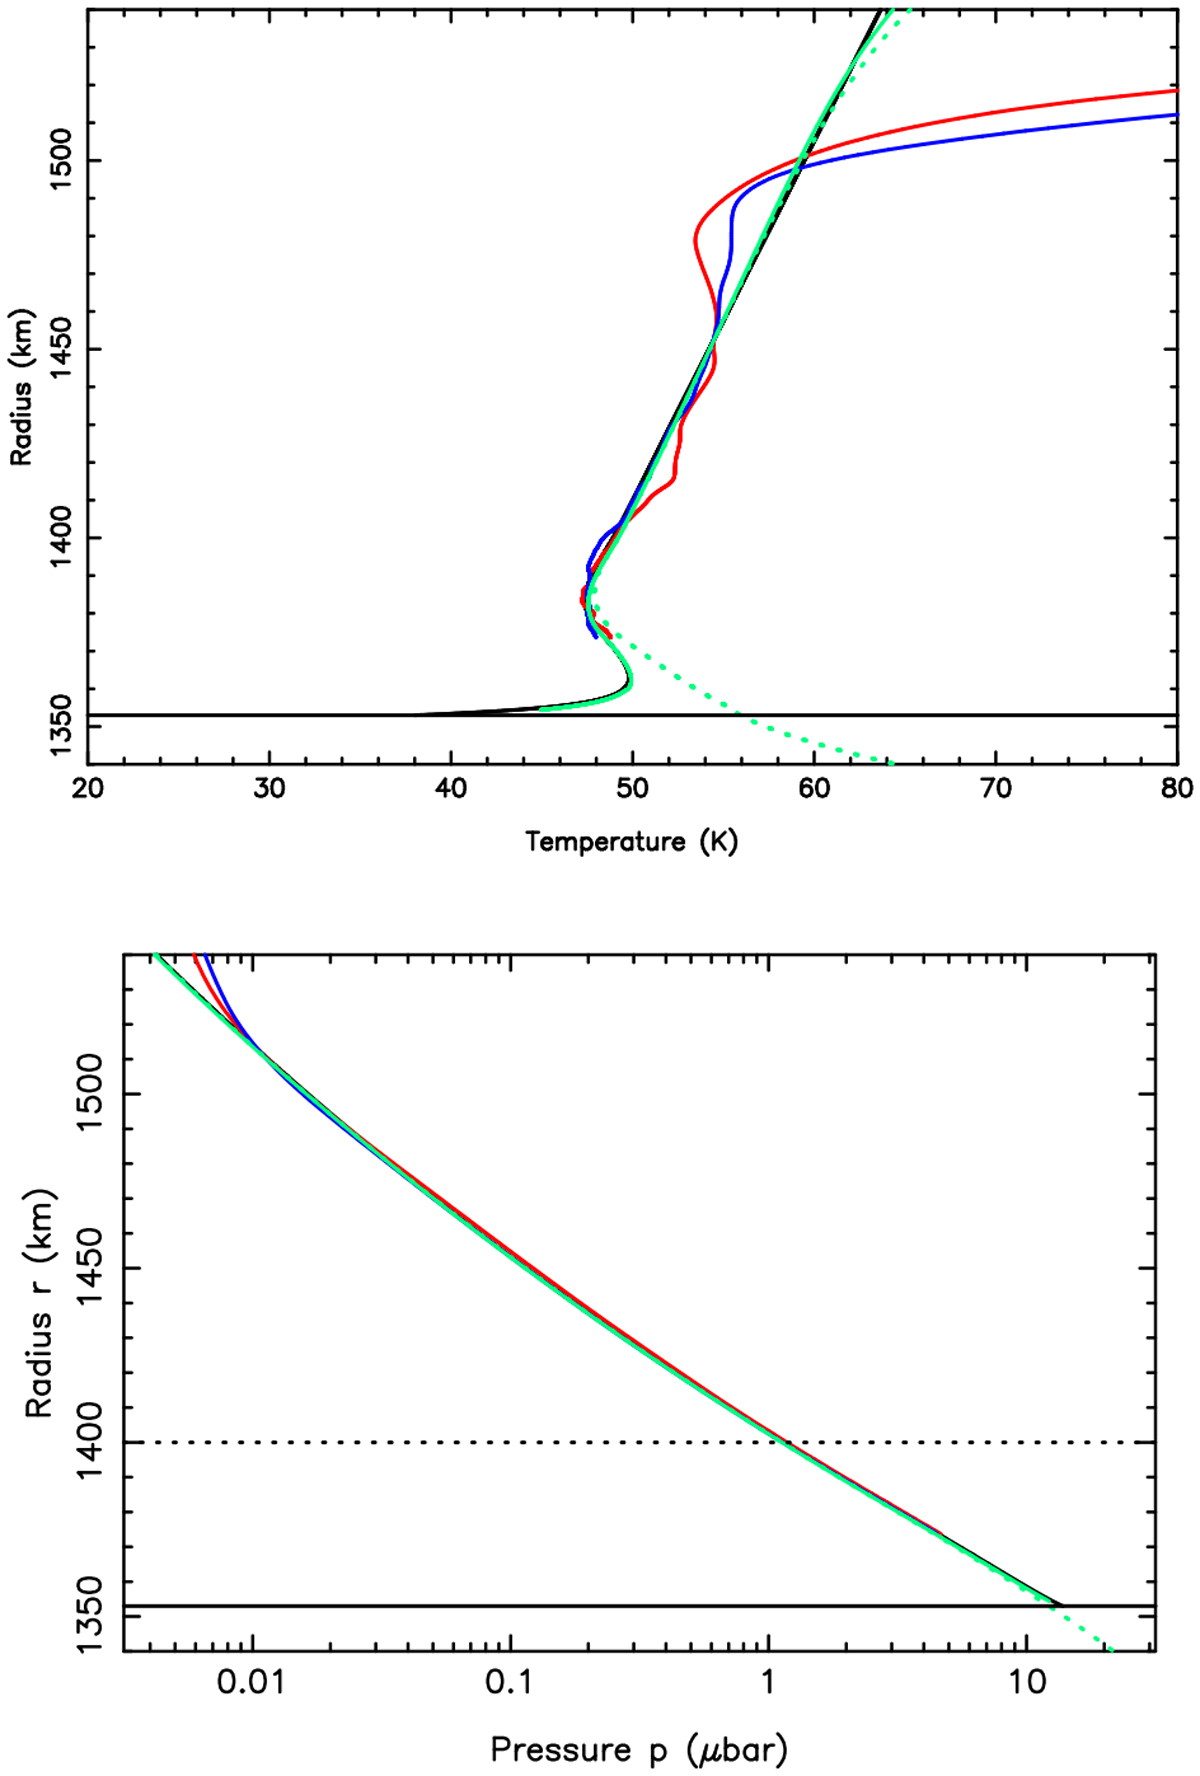
Effect of the secondary stellar image on the inversion results. Upper panel: Effect on the temperature profiles. The smooth black line connects these profiles to the surface at 38 K, where the pressure is set to 14 µbar. The resulting density profile is used to generate synthetic light curves that feed the Abel inversion procedure. The solid green line is the retrieved T(r) profile with only the primary image accounted for. The green dotted line is the retrieved profile where the primary and secondary images have been added. The profiles obtained from the inversion of La Palma’s light curve at ingress and egress (in red and blue, respectively) are shown for comparison (see also Figs. 9– 11). Black horizontal solid and dotted lines show Triton’s surface and reference radius (1400 km). Lower panel: Same, but with the pressure profiles.
Current usage metrics show cumulative count of Article Views (full-text article views including HTML views, PDF and ePub downloads, according to the available data) and Abstracts Views on Vision4Press platform.
Data correspond to usage on the plateform after 2015. The current usage metrics is available 48-96 hours after online publication and is updated daily on week days.
Initial download of the metrics may take a while.


