Fig. B.1

Download original image
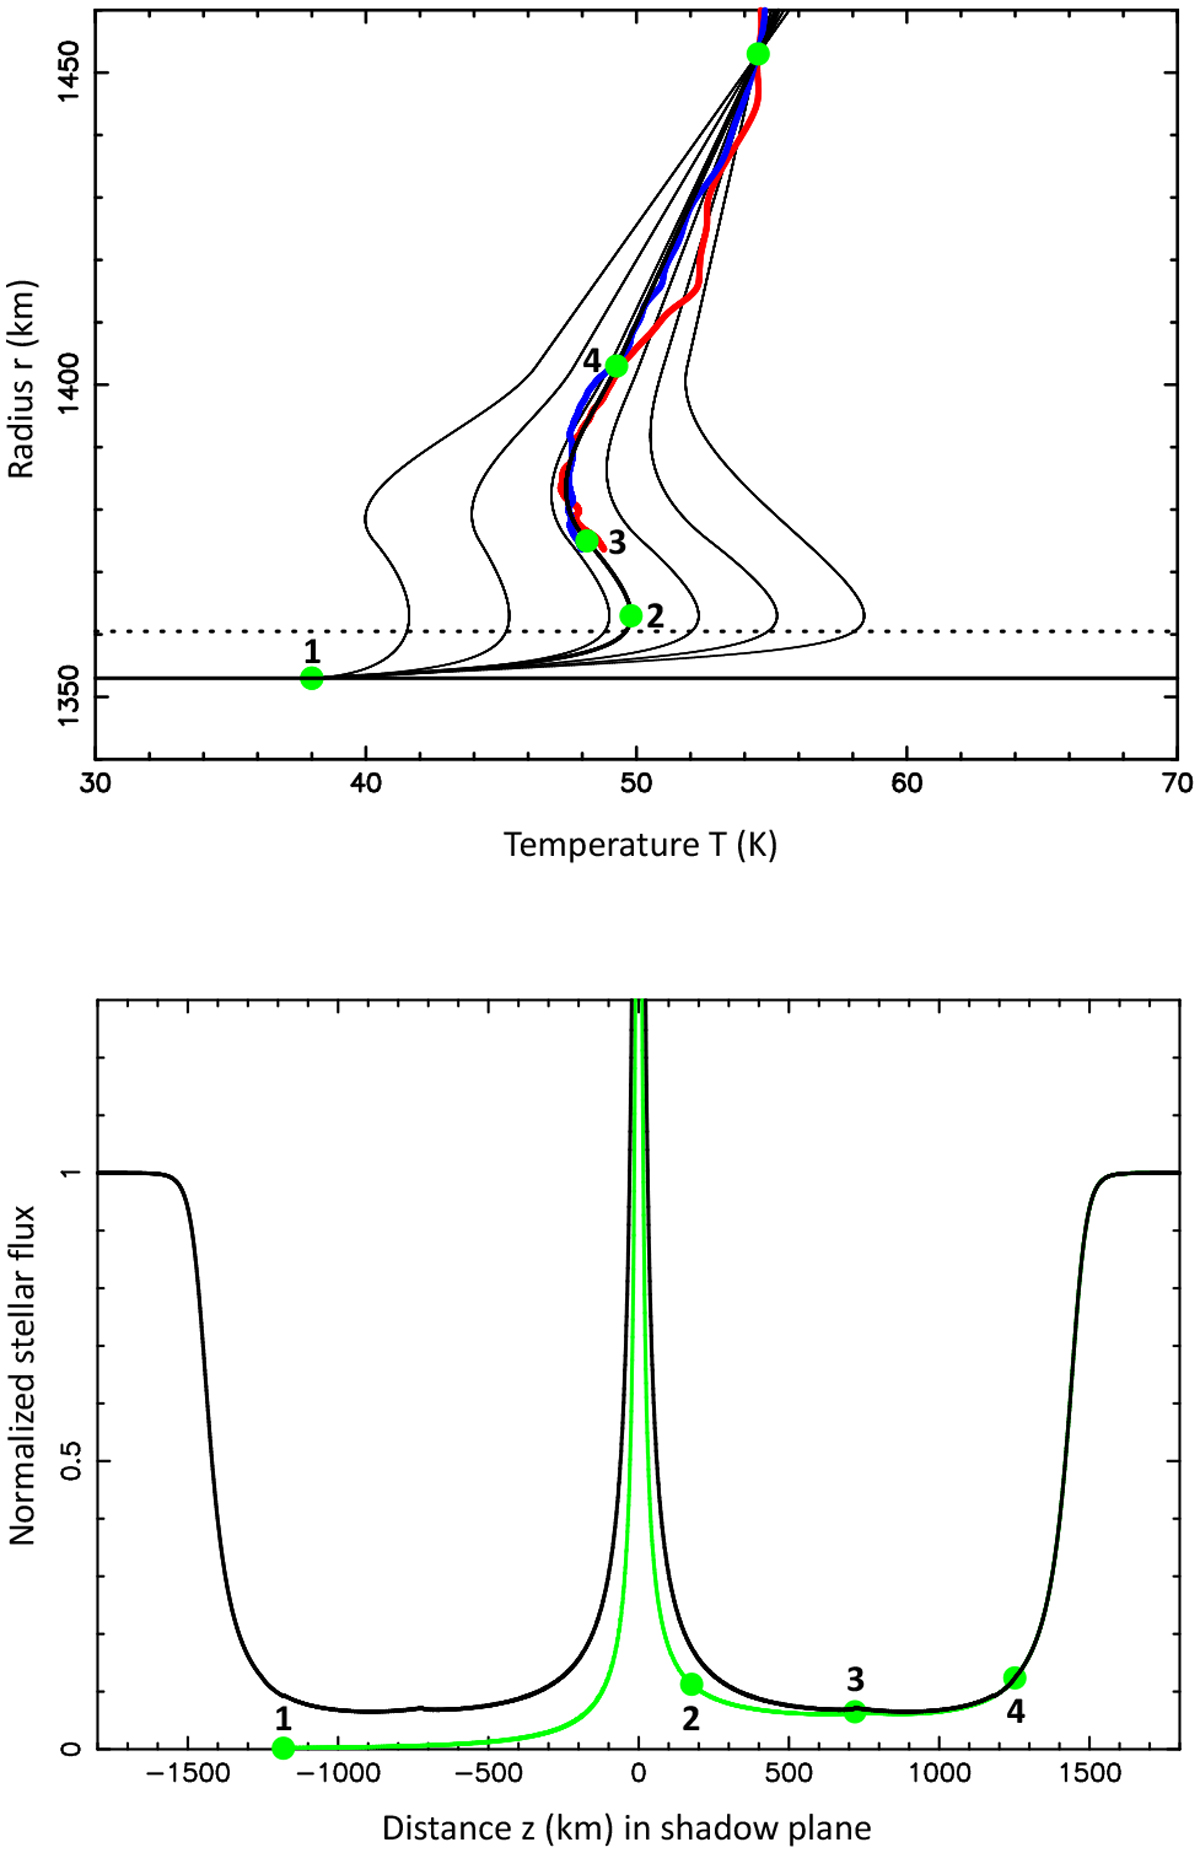
Template temperature profiles and result of the ray-tracing code. Upper panel: Six template temperature profiles, indicated by the thin black lines, obtained taking values ϕ0 = 0.370, 0.365, 0.360, 0.355, 0.350, and 0.3445 (from left to right) of Triton’s contribution to the normalised occultation light curve at La Palma. The rightmost profile (corresponding to ϕ0 = 0.3445) is the profile obtained from the calibration images taken before the event. Exploring ϕ0 with small incremental steps, we find a best fit to the central flash for ϕ0 = 0.35885 (see the thicker black template profile, where the green dots labelled 1 to 4 are prescribed particular points in the Dias-Oliveira et al. 2015 model, as specified in Table B.1). We note that all the profiles go through the boundary condition T = 54.5 K at r = 1453 km (100 km altitude, upper green dot). The inverted profiles for La Palma corresponding to ϕ0 = 0.35885 are shown in red (ingress) and blue (egress). The horizontal dotted line marks the altitude of the central flash layer. Lower panel: Result of the ray-tracing code, using the best T(r) profile of the upper panel and the best fit value of p1400 = 1.18 µbar (Table 4). The normalised stellar flux is plotted against the distance to Triton’s shadow centre. The green curve represents the flux if only one stellar image is present, and the green dots show the correspondence with the points labelled 1 to 4 in the upper panel. The black curve is the sum of the fluxes from two stellar images, i.e. the sum of the green curve and its mirrored version with respect to the z = 0 axis. This black curve is then used to fit the observations.
Current usage metrics show cumulative count of Article Views (full-text article views including HTML views, PDF and ePub downloads, according to the available data) and Abstracts Views on Vision4Press platform.
Data correspond to usage on the plateform after 2015. The current usage metrics is available 48-96 hours after online publication and is updated daily on week days.
Initial download of the metrics may take a while.


