Fig. 25

Download original image
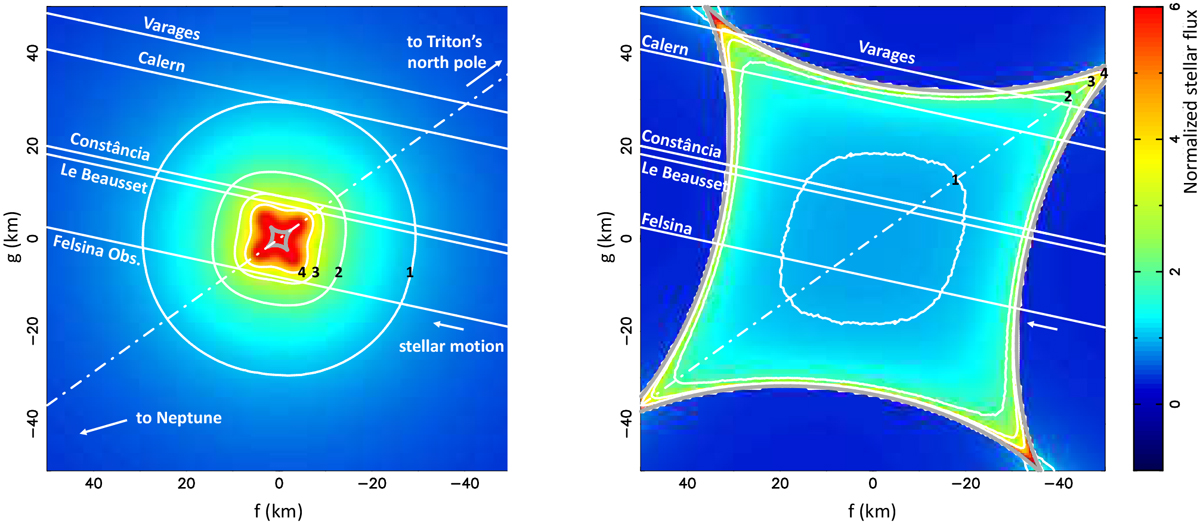
Maps of the central flash intensity. Left panel: map of the central flash intensity, adopting the 1σ- upper limit ϵ′ = 0.0011 for the apparent oblateness of the flash layer (corresponding to a deprojected oblateness ϵ = 0.0019) (see text for details). The black labels along the iso-intensity contours (in curves) indicate the received stellar flux in units of its unocculted value. The grey diamond-shaped feature near the centre is the caustic curve described by Eq. (4) and corresponding to ϵ′ = 0.0011. In the case considered here, the flash layer is assumed to be aligned with the apparent direction of Triton’s poles, indicated by the dash-dotted line. Neptune’s direction is determined from the position angle 286° of Triton with respect to the planet at the moment of the occultation. Right panel: same, but adopting the oblate solution ϵ = 0.042 found by Elliot et al. (1997) from the shape of a central flash observed during the 14 August 1995 occultation.
Current usage metrics show cumulative count of Article Views (full-text article views including HTML views, PDF and ePub downloads, according to the available data) and Abstracts Views on Vision4Press platform.
Data correspond to usage on the plateform after 2015. The current usage metrics is available 48-96 hours after online publication and is updated daily on week days.
Initial download of the metrics may take a while.


