Fig. 23

Download original image
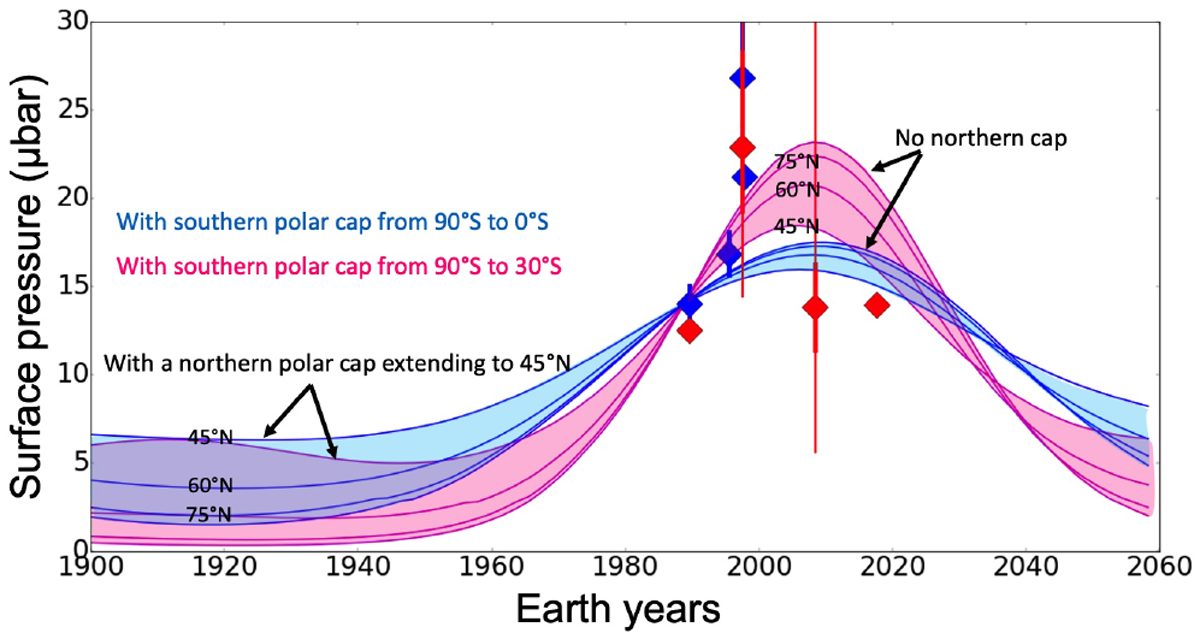
Surface pressure cycle on Triton as simulated with the VTM assuming a different fixed N2 ice distribution in both hemispheres. A thermal inertia of 1000 J s−1/2 m−2 K−1 (SI) was assumed. Bertrand et al. (2022) include more simulations in their paper, and their Fig. 9 shows cases with different thermal inertias. It is of note that their simulations show that a lower thermal inertia would delay the peak of the surface pressure, in opposition with the occultation data points. The blue lines refer to a southern cap extending to the equator, while the pink lines are for a southern cap extending to 30° S. Each line, marked with its corresponding value, refers to a different extension of the northern cap: 45° N, 60° N, 75° N, and no cap.
Current usage metrics show cumulative count of Article Views (full-text article views including HTML views, PDF and ePub downloads, according to the available data) and Abstracts Views on Vision4Press platform.
Data correspond to usage on the plateform after 2015. The current usage metrics is available 48-96 hours after online publication and is updated daily on week days.
Initial download of the metrics may take a while.


