Fig. 22

Download original image
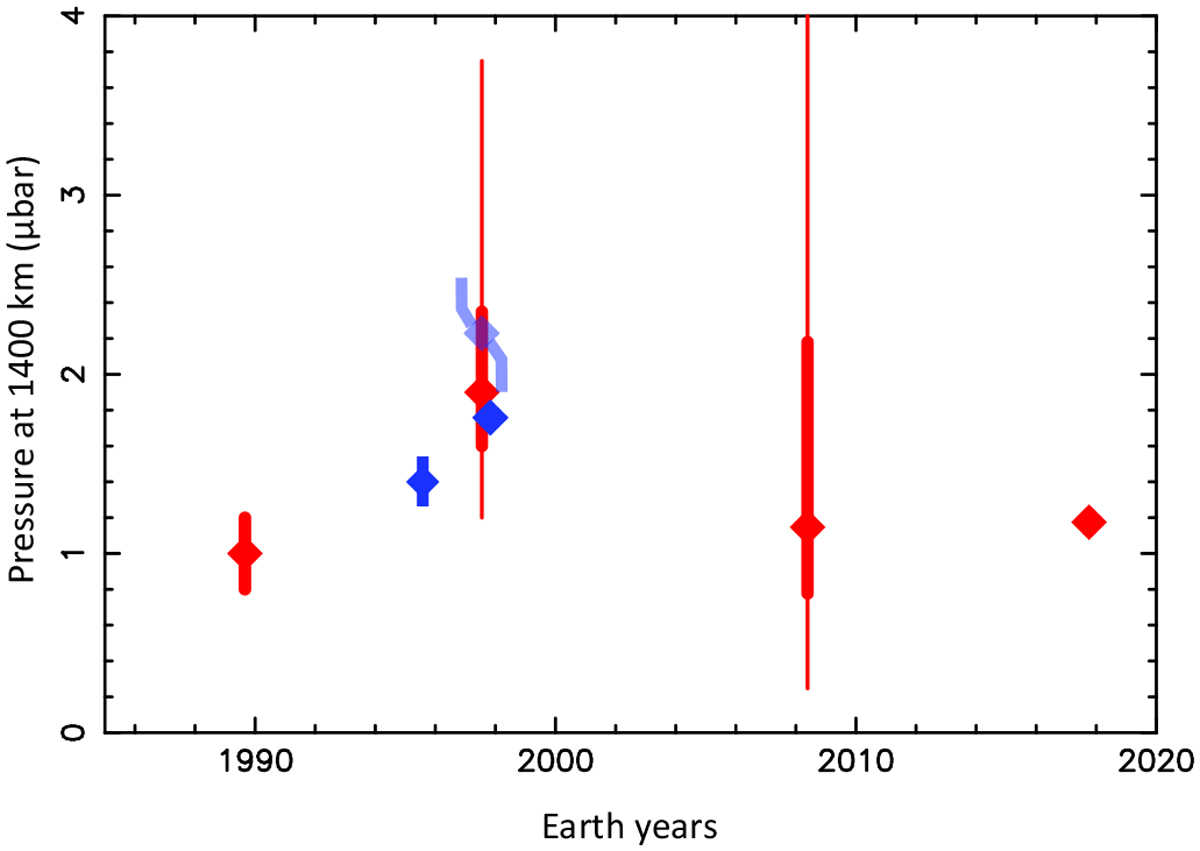
Triton’s atmospheric pressure seasonal variations with time, using the values from Table 4. Our results are in red, and values taken from other works are plotted in blue. For better viewing, the value derived by Elliot et al. (2000a) from the 18 July 1997 occultation is plotted in a semi-transparent blue colour, using the same dataset that we are using here for that date, with our red diamond-shaped point just below it. For all points, the thick error bars correspond to 1σ confidence levels. We note that for the 4 November 1997 and 5 October 2017 values, the 1σ error bar is smaller than the diamond-shaped symbol and therefore is not visible. For the 18 July 1997 and 21 May 2008 events, we have also plotted for information our 3σ error bars as thinner lines (see text for discussion).
Current usage metrics show cumulative count of Article Views (full-text article views including HTML views, PDF and ePub downloads, according to the available data) and Abstracts Views on Vision4Press platform.
Data correspond to usage on the plateform after 2015. The current usage metrics is available 48-96 hours after online publication and is updated daily on week days.
Initial download of the metrics may take a while.


