Fig. 18

Download original image
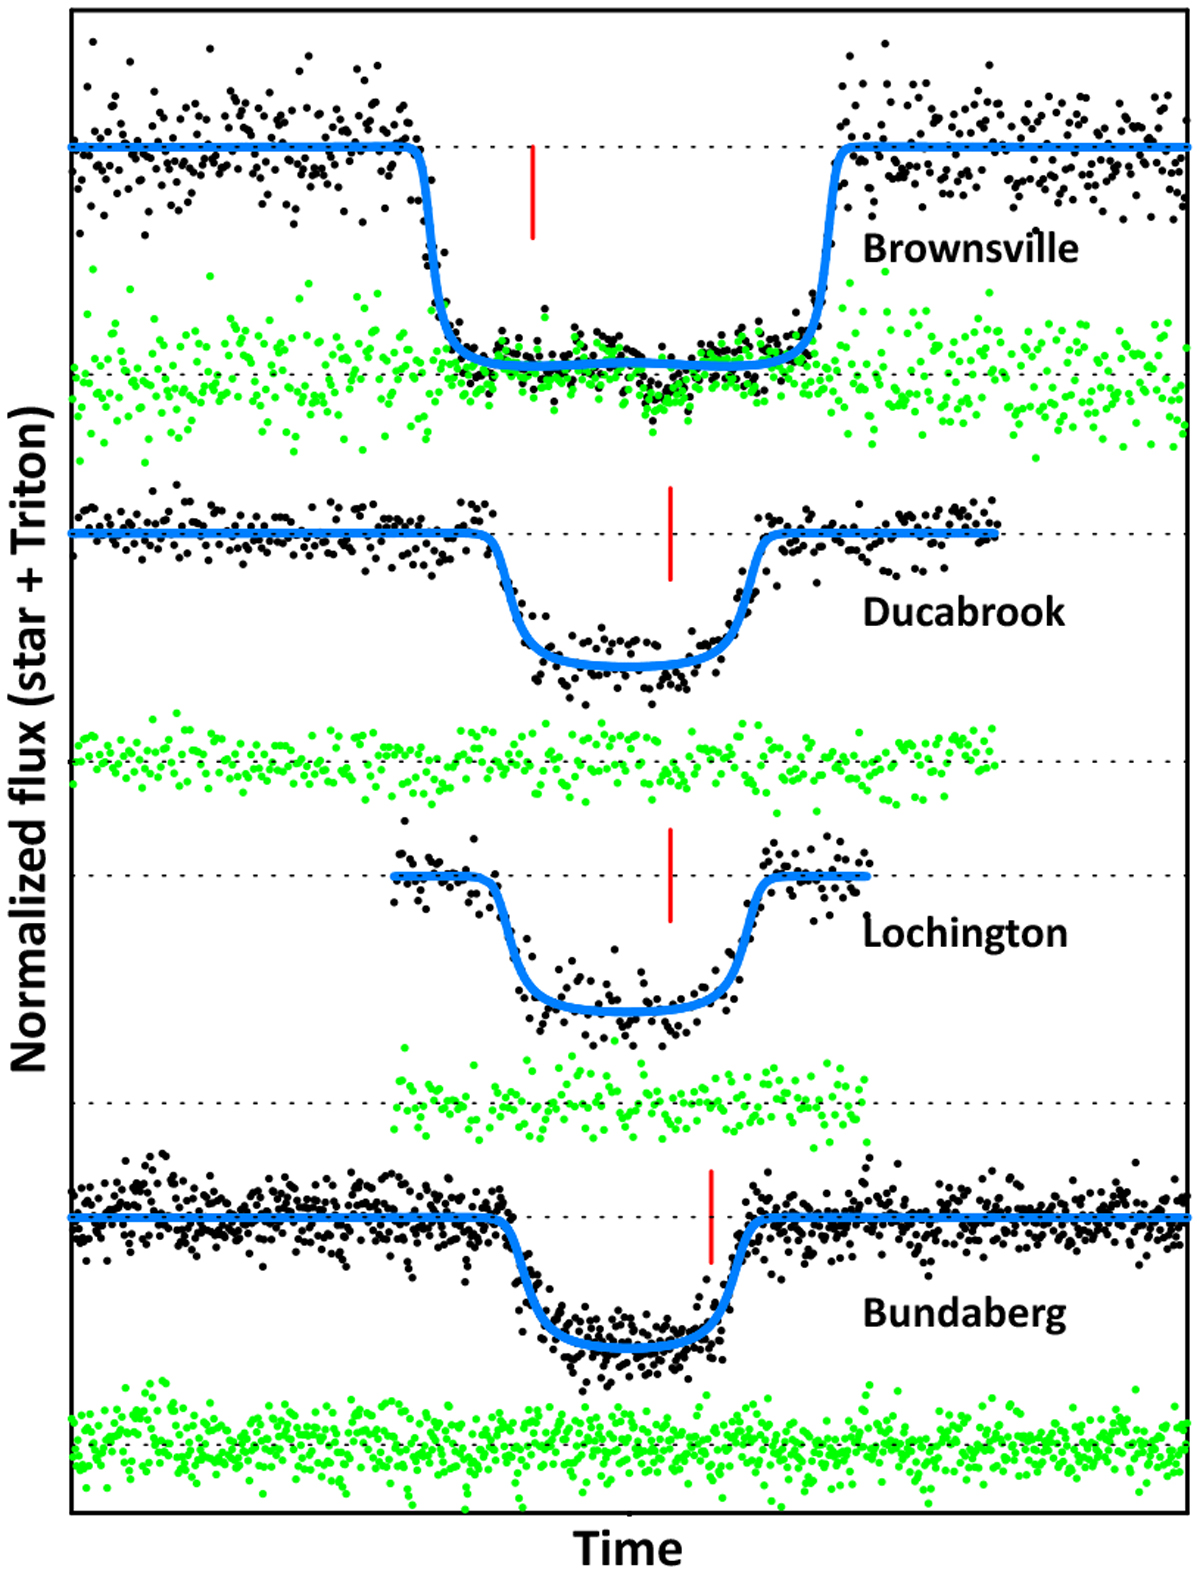
Simultaneous fits to the 18 July 1997 light curves. The panel covers 300 s in time. All the light curves have been shifted so that the mid-occultation times are aligned. The red vertical tick marks indicate 10:10 UTC at the Brownsville station (USA) and 10:18 UTC for the three Australian stations. The blue lines are simultaneous fits to the data (black dots), using the best value found in Fig. 17, p1400 = 1.9 µbar, and the temperature profile shown in Fig. 10. The green dots are the fit residuals. For each light curve, the upper dotted line is the normalised value of the star plus Triton flux, and the lower dotted line is the background flux. We note that the data from the Brownsville station were normalised during the event, as shown in Elliot et al. (2000a).
Current usage metrics show cumulative count of Article Views (full-text article views including HTML views, PDF and ePub downloads, according to the available data) and Abstracts Views on Vision4Press platform.
Data correspond to usage on the plateform after 2015. The current usage metrics is available 48-96 hours after online publication and is updated daily on week days.
Initial download of the metrics may take a while.


