Fig. 15

Download original image
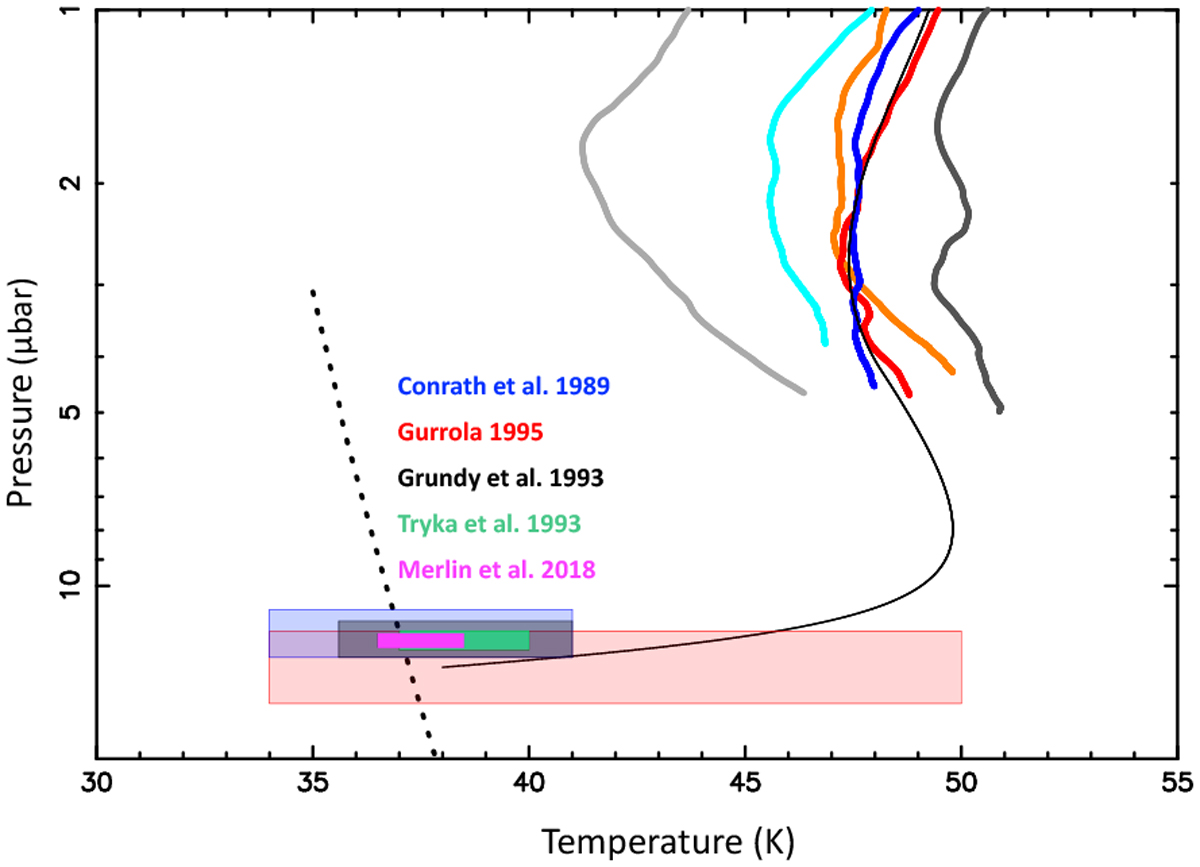
Close-up view of the lower panel of Fig. 10. The width of each coloured box is Triton’s surface temperature (Tsurf), as estimated by the various authors mentioned just above the boxes (see text for details). The heights of the boxes are the range of surface pressures, psurf, using the ideal gas law ![]() , where
, where ![]() is the surface molecular nitrogen density derived from our inversion of the RSS data (see text). We note that all the boxes intersect the vapour pressure equilibrium, which is plotted as a dotted line. This shows that the RSS surface density and the estimated surface temperatures are mutually consistent with a pressure being controlled by the N2 ice sublimation.
is the surface molecular nitrogen density derived from our inversion of the RSS data (see text). We note that all the boxes intersect the vapour pressure equilibrium, which is plotted as a dotted line. This shows that the RSS surface density and the estimated surface temperatures are mutually consistent with a pressure being controlled by the N2 ice sublimation.
Current usage metrics show cumulative count of Article Views (full-text article views including HTML views, PDF and ePub downloads, according to the available data) and Abstracts Views on Vision4Press platform.
Data correspond to usage on the plateform after 2015. The current usage metrics is available 48-96 hours after online publication and is updated daily on week days.
Initial download of the metrics may take a while.


