Fig. 14

Download original image
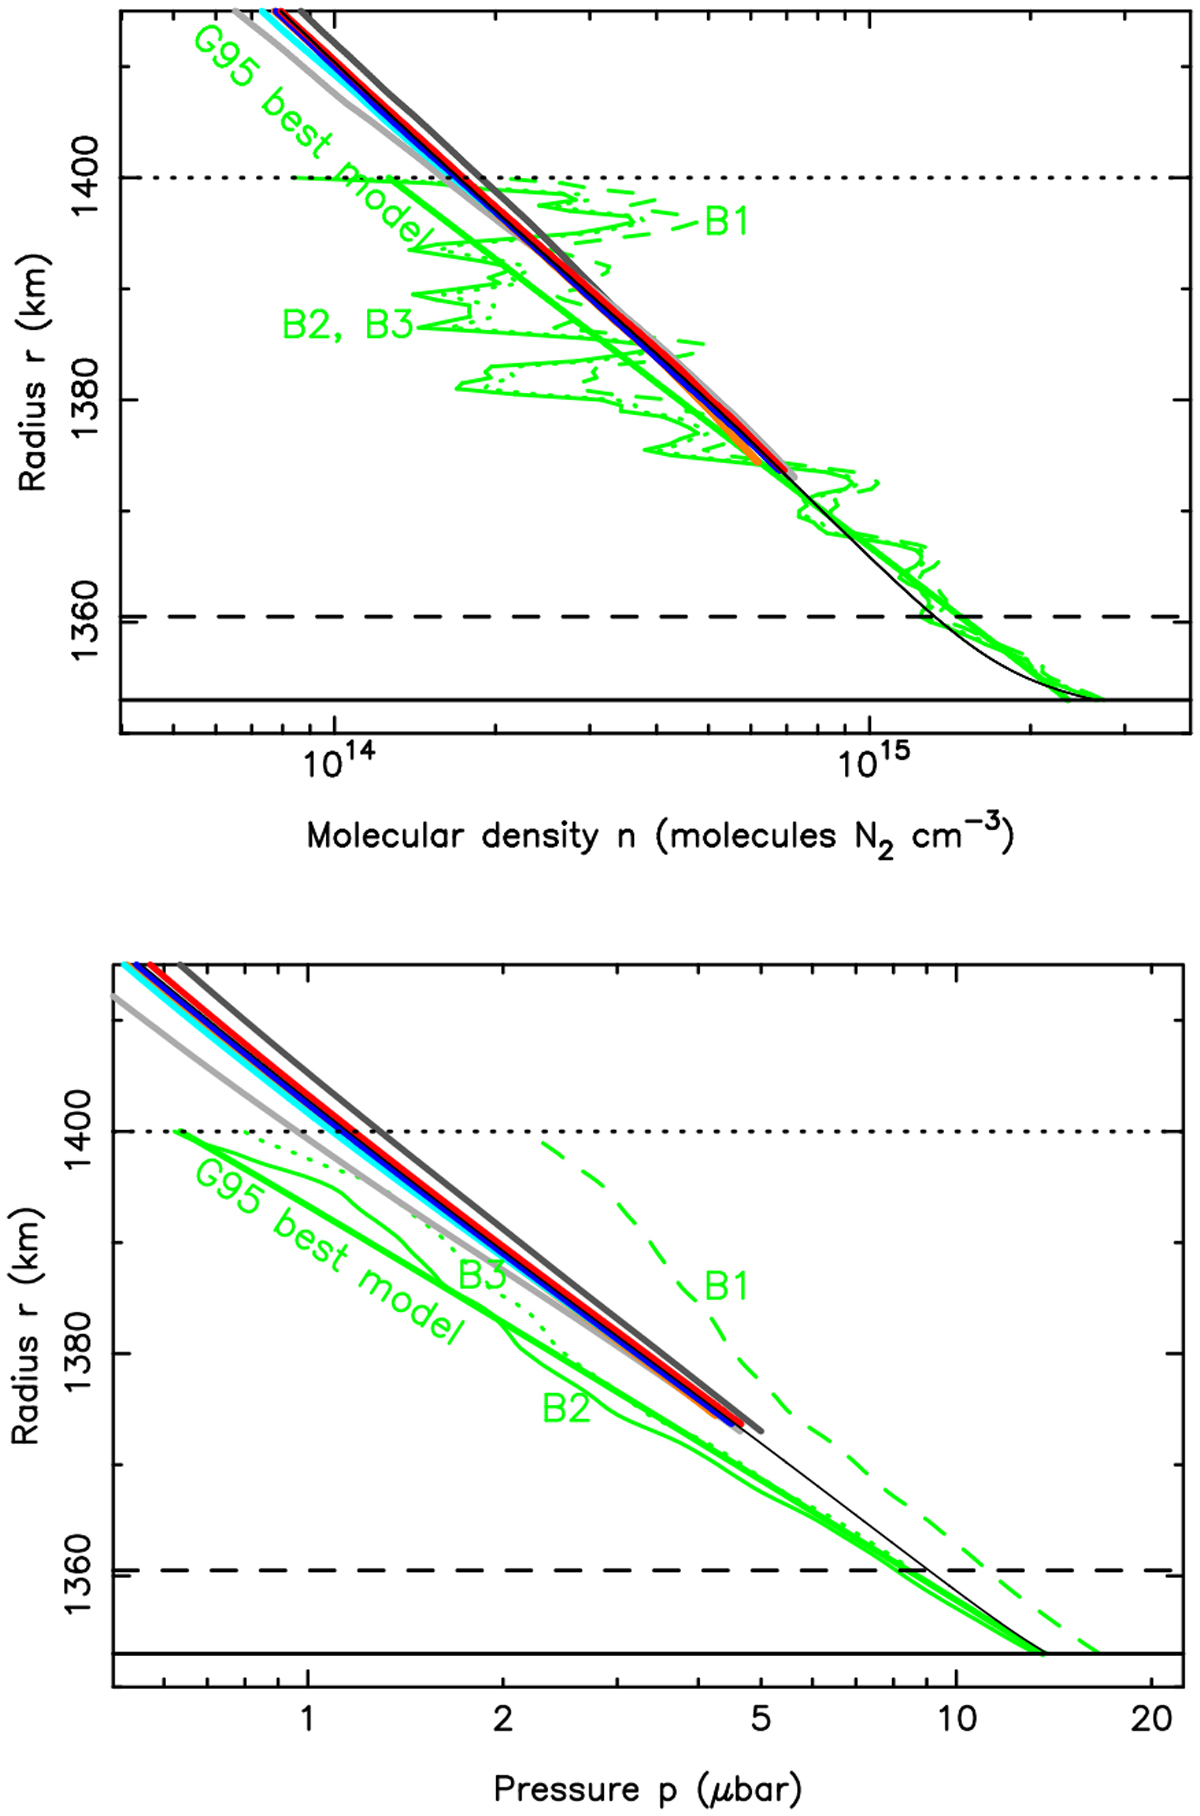
Close-up view of Fig. 9. Upper panel: close-up view of the density profiles. Various profiles derived from the RSS occultation are shown in green. The dashed line is the profile retrieved by Tyler et al. (1989) using a polynomial extrapolation B1 to correct for the RSS phase instability. The thin solid line is the profile retrieved by G95 using the polynomial extrapolation B2. The dotted line is the same by G95, but using the polynomial extrapolation B3. The thick solid line is the best model of G95, based on the B2 profile. Lower panel: same for the pressure profiles.
Current usage metrics show cumulative count of Article Views (full-text article views including HTML views, PDF and ePub downloads, according to the available data) and Abstracts Views on Vision4Press platform.
Data correspond to usage on the plateform after 2015. The current usage metrics is available 48-96 hours after online publication and is updated daily on week days.
Initial download of the metrics may take a while.


