Fig. 13

Download original image
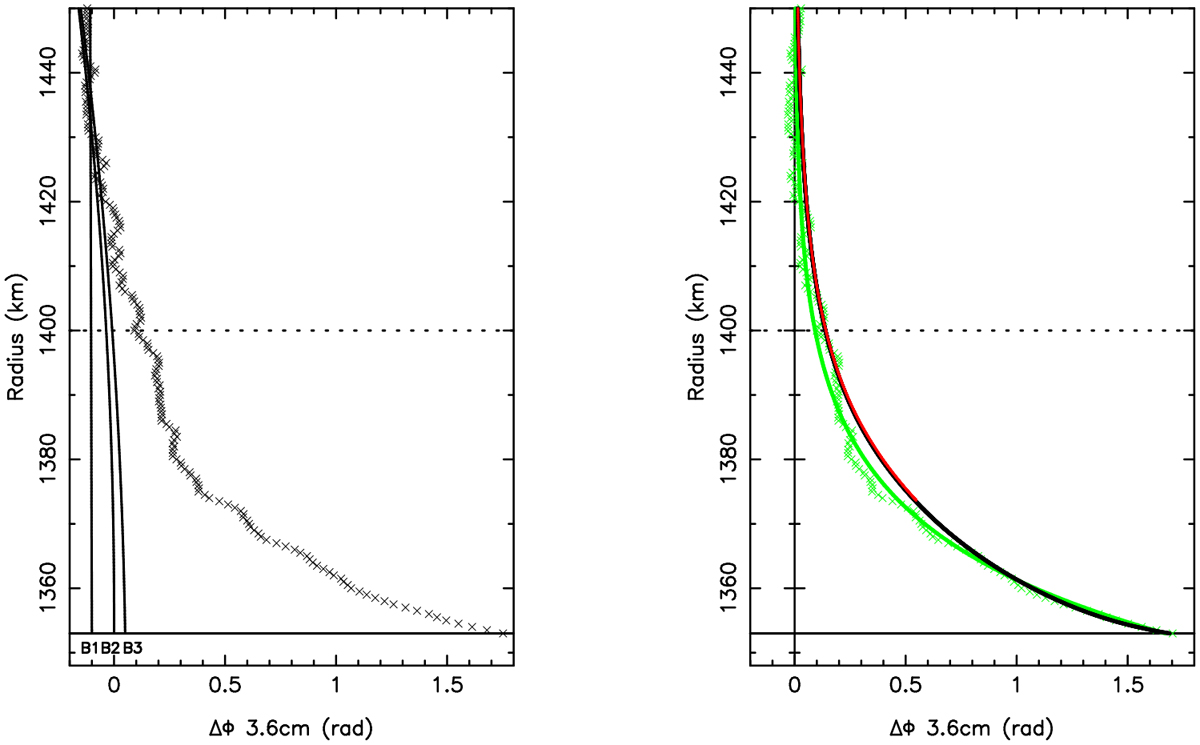
Radio phase delay during the egress of the V2 RSS occultation on 25 August 1989 in the 3.6 cm X band. Left panel: radio phase delay observed (adapted from G95). The crosses are the data, and the three solid lines (labelled B1, B2, and B3) are three polynomial modellings of the phase delay baseline. As discussed by G95, the preferred baseline solution is B2. Right panel: radio phase after subtraction of the B2 baseline polynomial shown in the left panel (green crosses), thus representing the effect of the atmosphere only. The green line marks the smooth version of that radio phase delay, as constructed by G95. The red profile is the phase delay that would be observed at 3.6 cm from the retrieved density profile of La Palma at immersion (see Fig. 9). Other phase delay profiles obtained from La Palma (emersion) and Helmos would be indistinguishable from the red profile and are not plotted here for sake of clarity. The black profile is the phase delay obtained from our best model of Triton’s atmosphere (see text for details).
Current usage metrics show cumulative count of Article Views (full-text article views including HTML views, PDF and ePub downloads, according to the available data) and Abstracts Views on Vision4Press platform.
Data correspond to usage on the plateform after 2015. The current usage metrics is available 48-96 hours after online publication and is updated daily on week days.
Initial download of the metrics may take a while.


