Fig. 8.
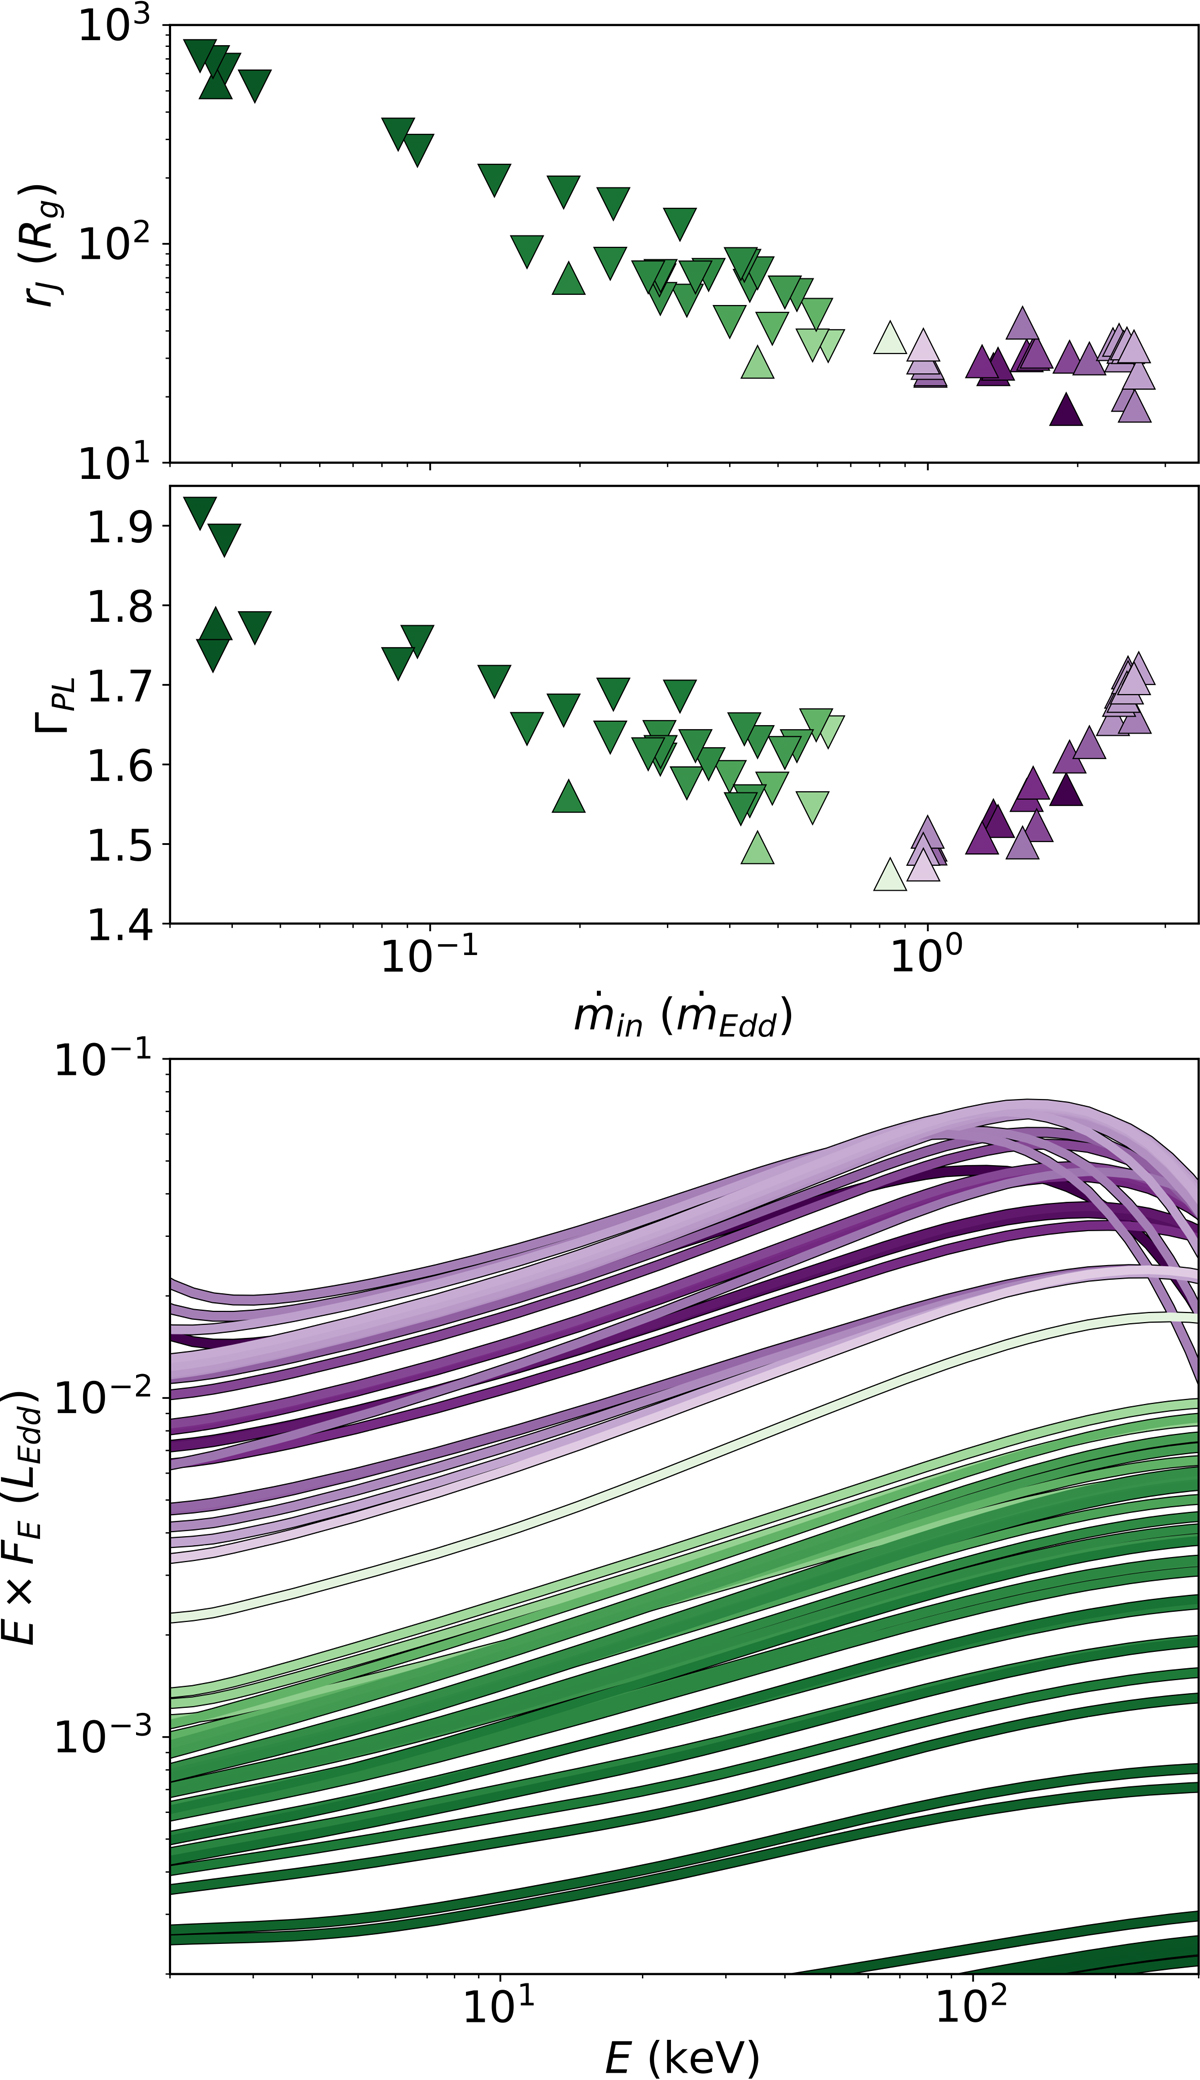
Download original image
Subset of all hard state observations with detected radio fluxes, using the same color-coding as in Fig. 9. The symbol shapes show the rising (up-pointing triangle) and decaying (down-pointing triangle) hard state. Top: distribution of these observations in the ṁin−rJ plane (x-axis at top). Middle: spectral index of the power law ΓPL from the Clavel et al. (2016) as function of the ṁin from our fits. Bottom: theoretical spectra associated with each solution (rJṁin) in the (theoretical) RXTE range 2−300 keV.
Current usage metrics show cumulative count of Article Views (full-text article views including HTML views, PDF and ePub downloads, according to the available data) and Abstracts Views on Vision4Press platform.
Data correspond to usage on the plateform after 2015. The current usage metrics is available 48-96 hours after online publication and is updated daily on week days.
Initial download of the metrics may take a while.