Fig. 7.
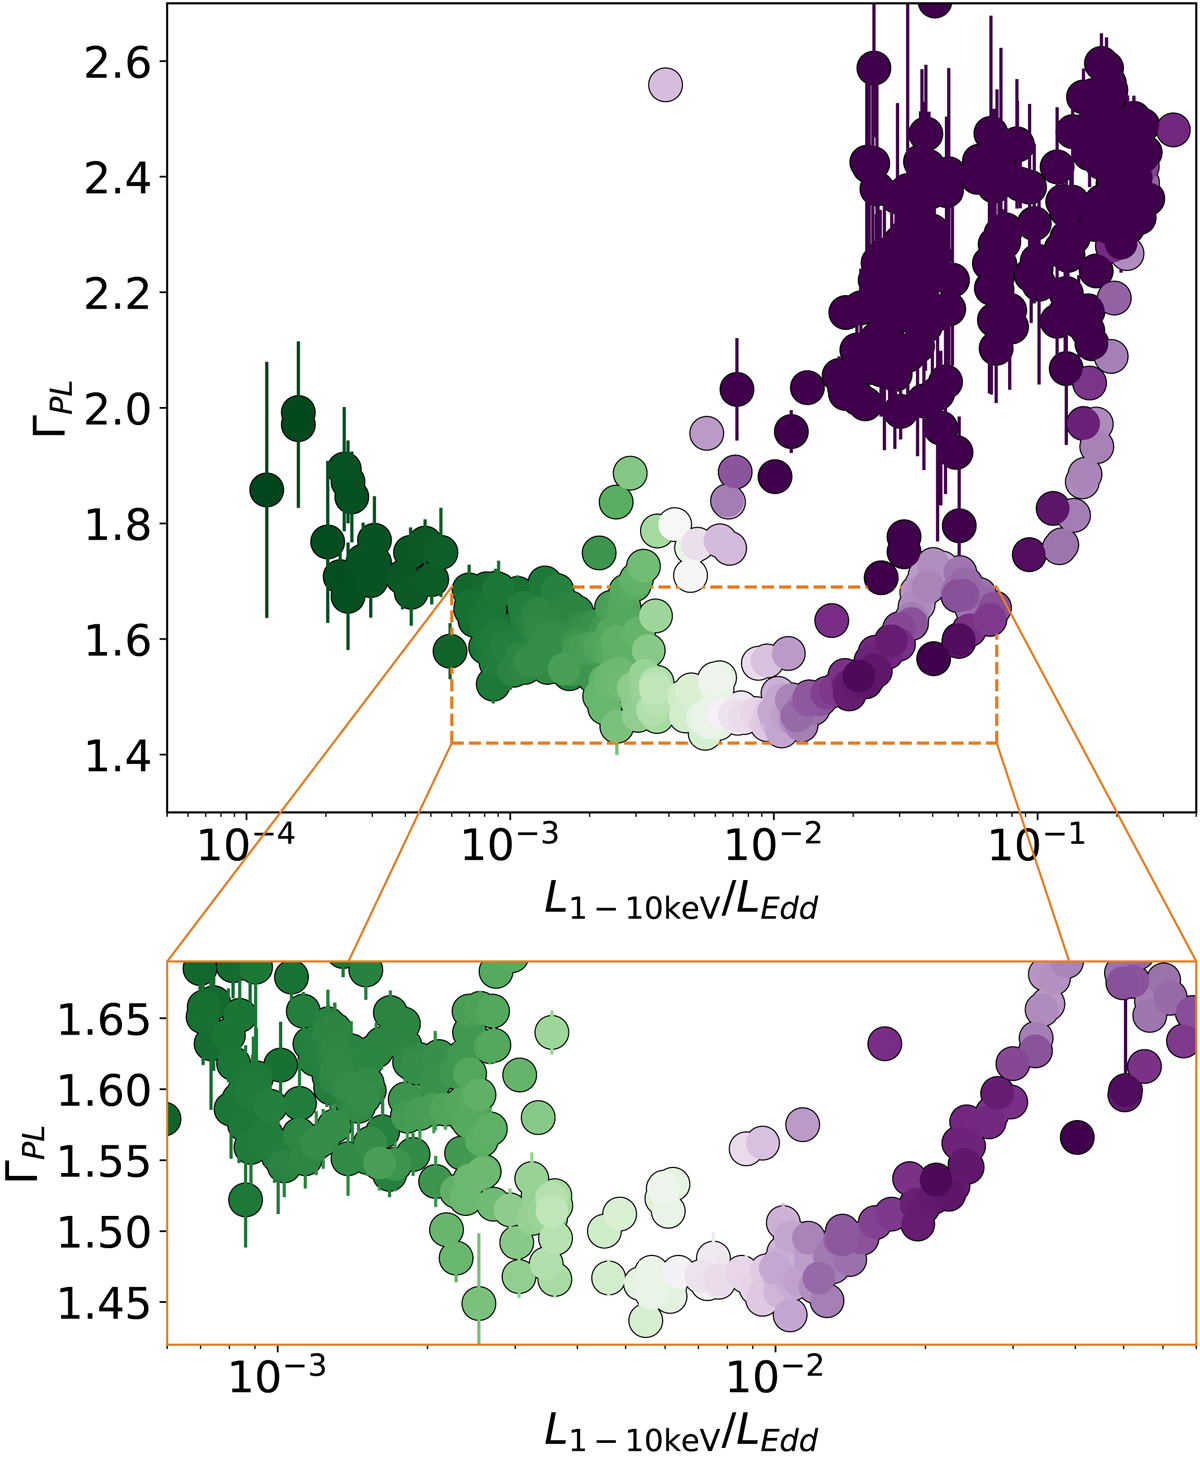
Download original image
Evolution of the power-law index ΓPL of each spectrum (Clavel et al. 2016) as a function of its luminosity in the 1−10 keV range. All four outbursts during the 2000s are overplotted (color-coding as in Fig. 9). Bottom panel: zoom-in on the zone inside the orange dashed rectangle in the top panel. For clarity, we do not show observations when ΓPL is unconstrained (soft states), but the usual values lie in the ΓPL ≈ 2.0−3.0 range.
Current usage metrics show cumulative count of Article Views (full-text article views including HTML views, PDF and ePub downloads, according to the available data) and Abstracts Views on Vision4Press platform.
Data correspond to usage on the plateform after 2015. The current usage metrics is available 48-96 hours after online publication and is updated daily on week days.
Initial download of the metrics may take a while.