Fig. 6.
Download original image
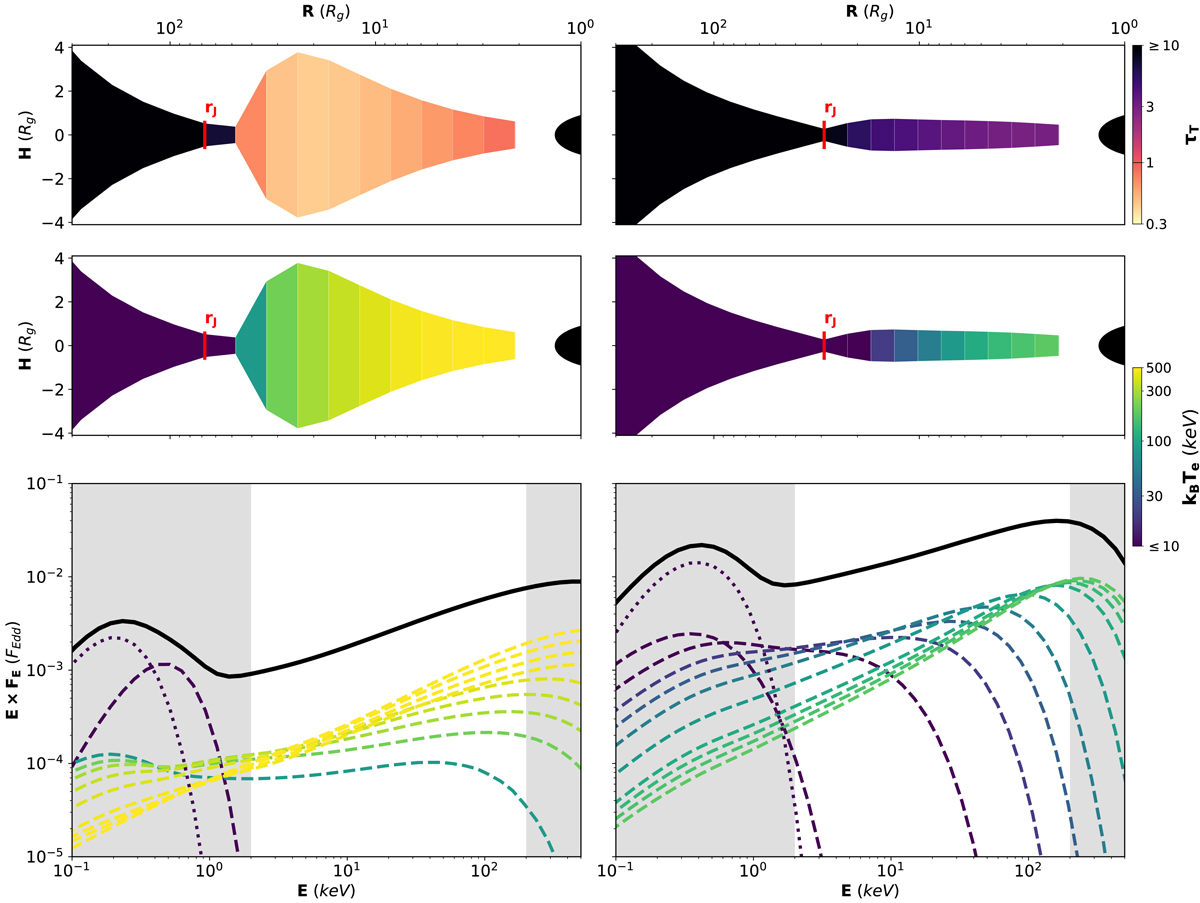
Geometrical shape and spectral energy distribution of the two solutions. Left: JED-SAD solution with rJ = 65 and ṁ = 0.5. Right: JED-SAD solution with rJ = 30 and ṁ = 1.3. For both solutions, the radial distribution of the JED is divided into ten portions. Top and middle panels: radial evolution of the vertical extension of the disk (x-axis at the top) compared to the black hole horizon represented by the black ellipsoid on the right side of each panel. The vertical Thomson optical depth (top) and the electron temperature (middle) are color-coded (top and bottom color bar, respectively). Bottom panels: total emitted spectrum in black with the contribution from the entire SAD (dotted line) and each JED portion (dashed lines), color-coded according to temperature (same as middle panels). The RXTE X-ray range is inside the gray background.
Current usage metrics show cumulative count of Article Views (full-text article views including HTML views, PDF and ePub downloads, according to the available data) and Abstracts Views on Vision4Press platform.
Data correspond to usage on the plateform after 2015. The current usage metrics is available 48-96 hours after online publication and is updated daily on week days.
Initial download of the metrics may take a while.