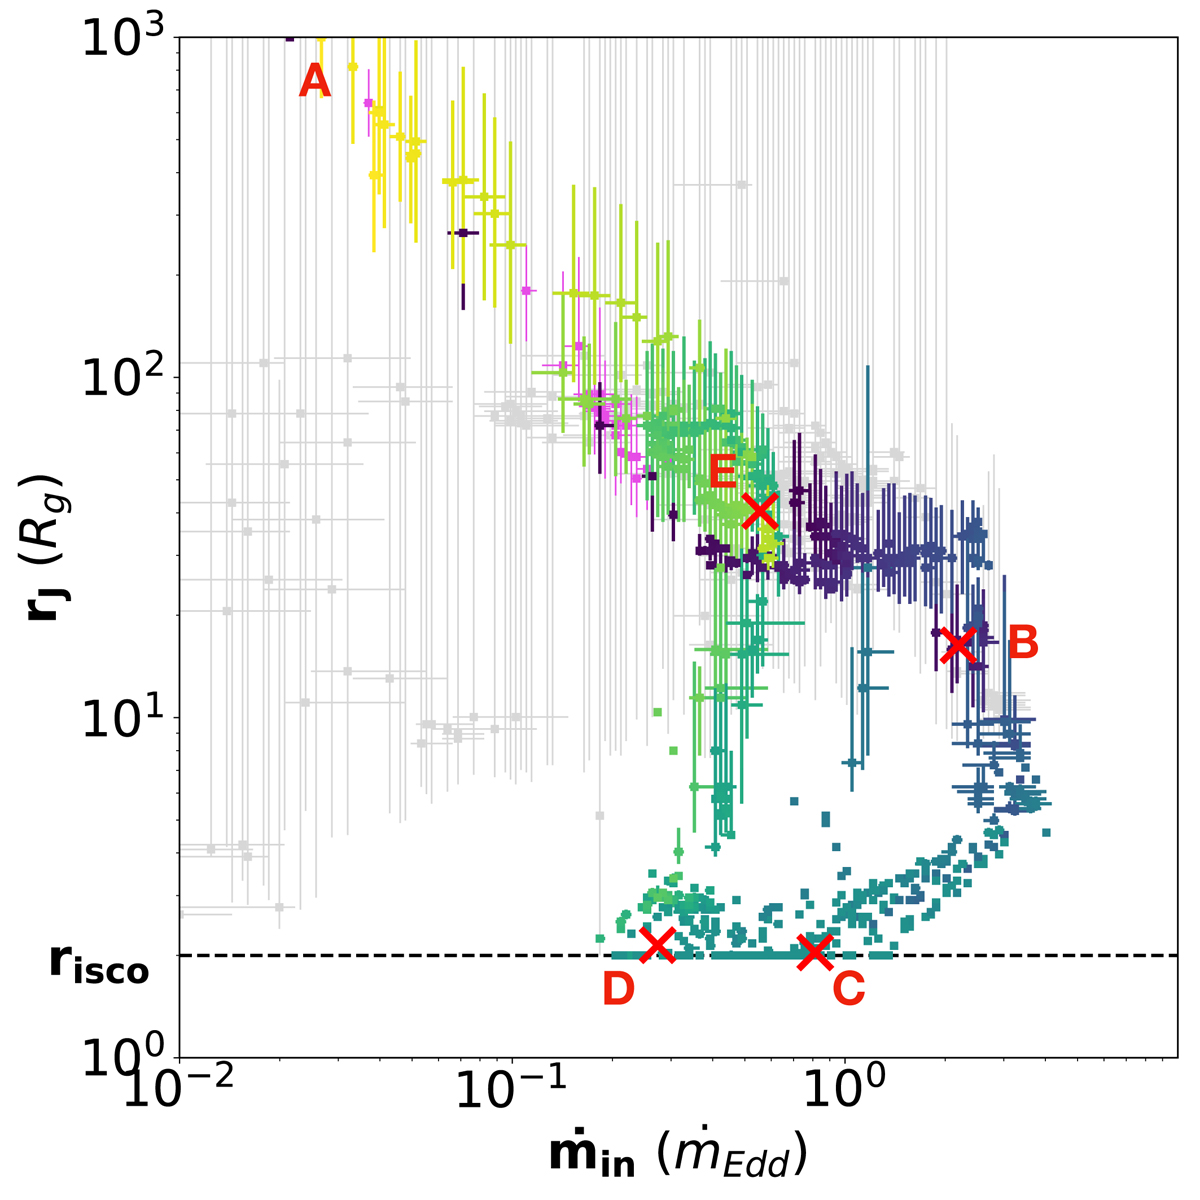
Fig. 4.
Download original image
Positions of all observation in the ṁin−rJ plane for the four outbursts of GX 339-4 covered by RXTE/PCA. All data points are shown in gray, and the constrained observations (see text) are color-coded as in Fig. 2. The points in pink are radio-constrained observations of the 2008–2009 failed outburst. Points A–E are placed at the average locations (of the four outbursts) for each phase to illustrate their approximate locations.
Current usage metrics show cumulative count of Article Views (full-text article views including HTML views, PDF and ePub downloads, according to the available data) and Abstracts Views on Vision4Press platform.
Data correspond to usage on the plateform after 2015. The current usage metrics is available 48-96 hours after online publication and is updated daily on week days.
Initial download of the metrics may take a while.