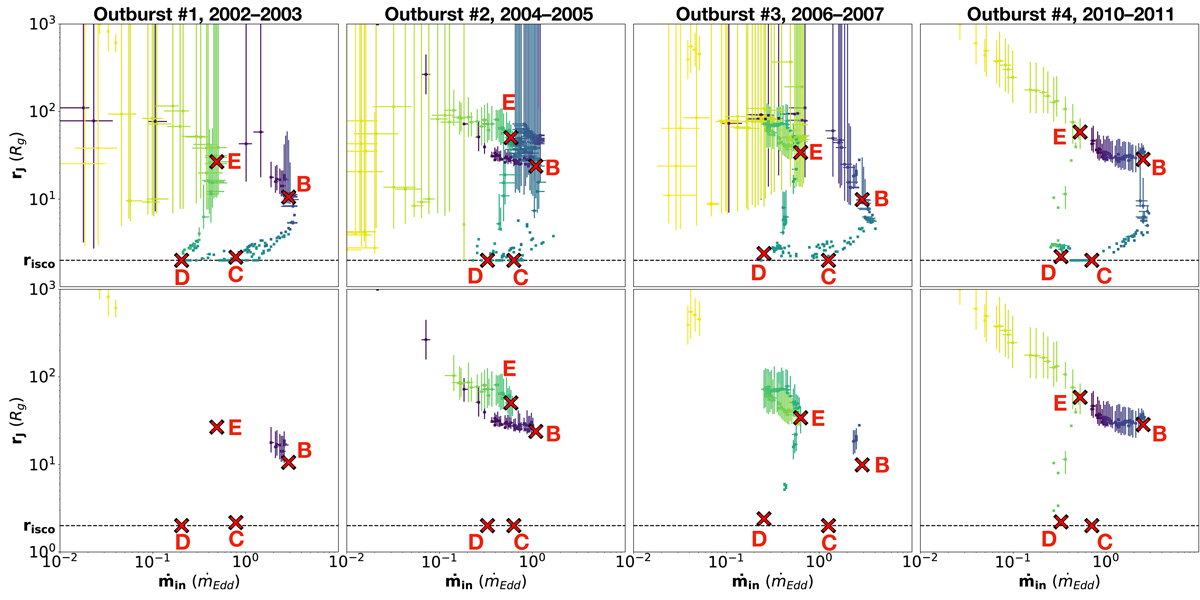
Fig. 3.
Download original image
Positions of each observation in the ṁin−rJ plane for each outburst: all observations (top), only those when radio constraints are present (bottom). The colors are the same as in Fig. 2: each outburst starts in the dark violet phase, transitions to the soft state in green, and comes back to the hard state in the light yellow phase. Additionally, the labels B–E from Fig. 2 are shown.
Current usage metrics show cumulative count of Article Views (full-text article views including HTML views, PDF and ePub downloads, according to the available data) and Abstracts Views on Vision4Press platform.
Data correspond to usage on the plateform after 2015. The current usage metrics is available 48-96 hours after online publication and is updated daily on week days.
Initial download of the metrics may take a while.