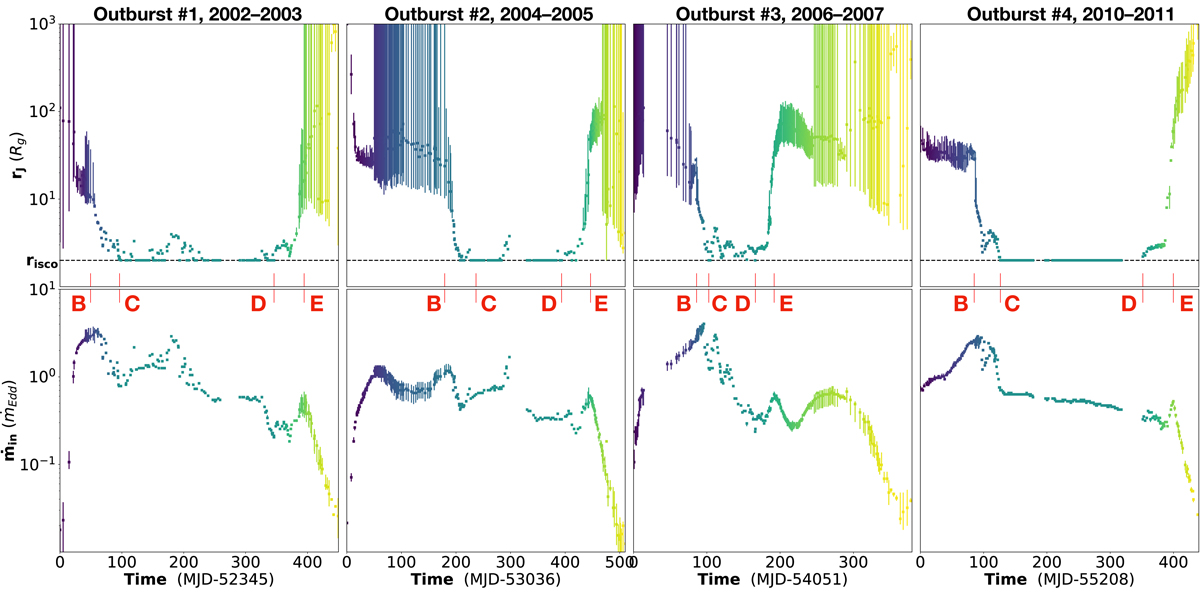
Fig. 2.
Download original image
Evolution along time of rJ (top) and ṁin (bottom) for all four outbursts of GX 339-4 observed by RXTE with their 5% confidence regions. For each outburst the timescale is chosen so that t = 0 corresponds to the first detection of the outburst (see Paper V for more details). The color-coding translates the time evolution for each outburst: starting in dark violet during the rising hard state and finishing in light yellow in the decaying hard state, using a constant color during the entire soft and soft-intermediate states. Four letters are placed to guide the evolution of each outburst: Point B is the last hard state of the rising phase, C and D are the first and last soft states, and E is the first hard state of the decaying phase.
Current usage metrics show cumulative count of Article Views (full-text article views including HTML views, PDF and ePub downloads, according to the available data) and Abstracts Views on Vision4Press platform.
Data correspond to usage on the plateform after 2015. The current usage metrics is available 48-96 hours after online publication and is updated daily on week days.
Initial download of the metrics may take a while.