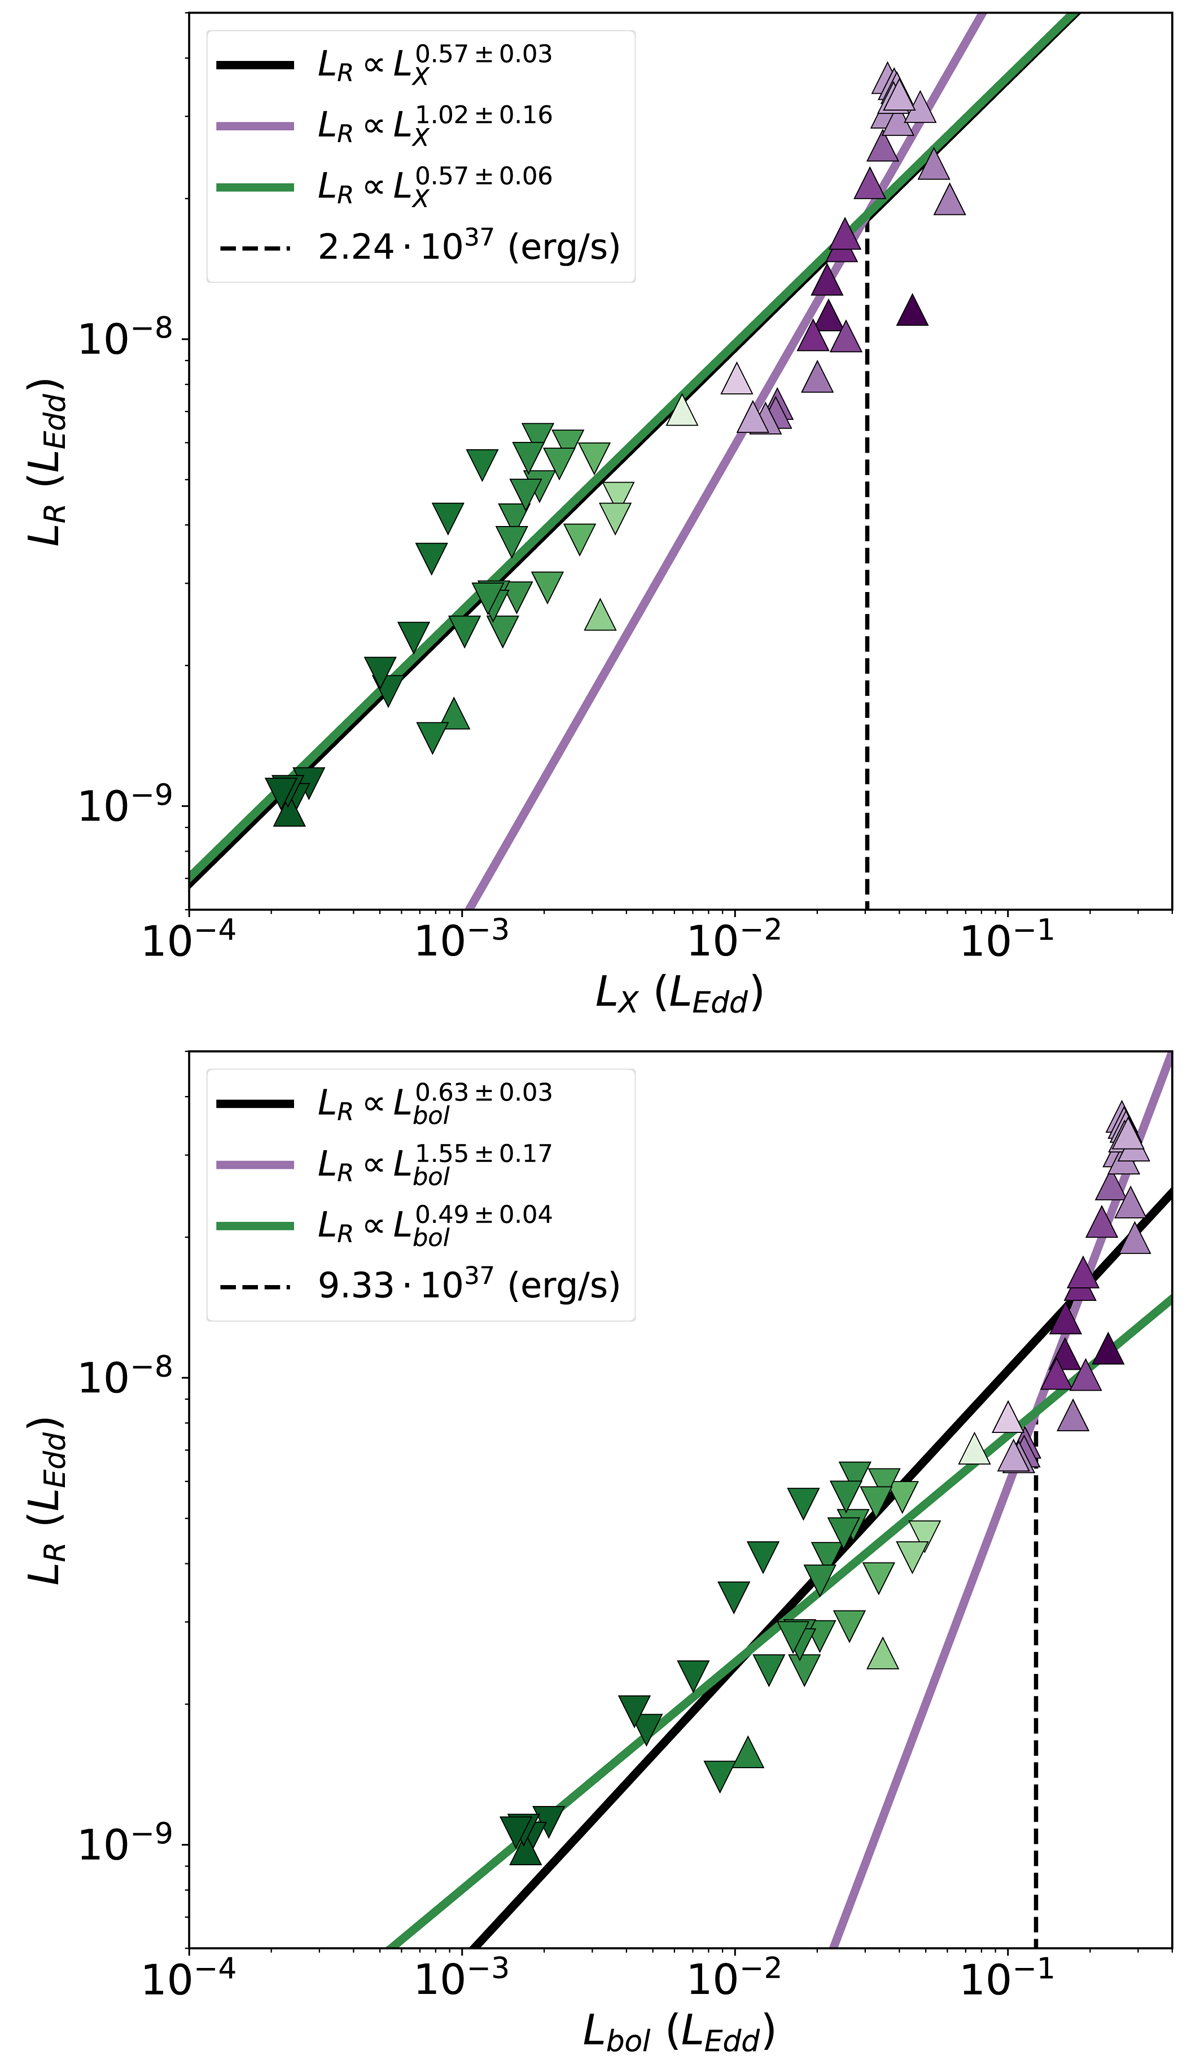
Fig. 10.
Download original image
Correlations between the observed radio fluxes and the fitted X-ray flux emitted by the accretion flow in two different energy ranges: classical 1−10 keV range (top) and bolometric (bottom). In each panel the symbol shows a rising (up-pointing triangle) or decaying (down-pointing triangle) hard state, and the color is the ratio Pcool/Padv of the radiative to the advected power (see color bar in Fig. 8). The solid lines indicate our fits: global correlations (black), with only Padv > Pcool solutions (green) and with only Padv < Pcool solutions (purple). A dashed line illustrates the location of the crossing point of the thick disk and slim disk correlations.
Current usage metrics show cumulative count of Article Views (full-text article views including HTML views, PDF and ePub downloads, according to the available data) and Abstracts Views on Vision4Press platform.
Data correspond to usage on the plateform after 2015. The current usage metrics is available 48-96 hours after online publication and is updated daily on week days.
Initial download of the metrics may take a while.