Fig. 7.
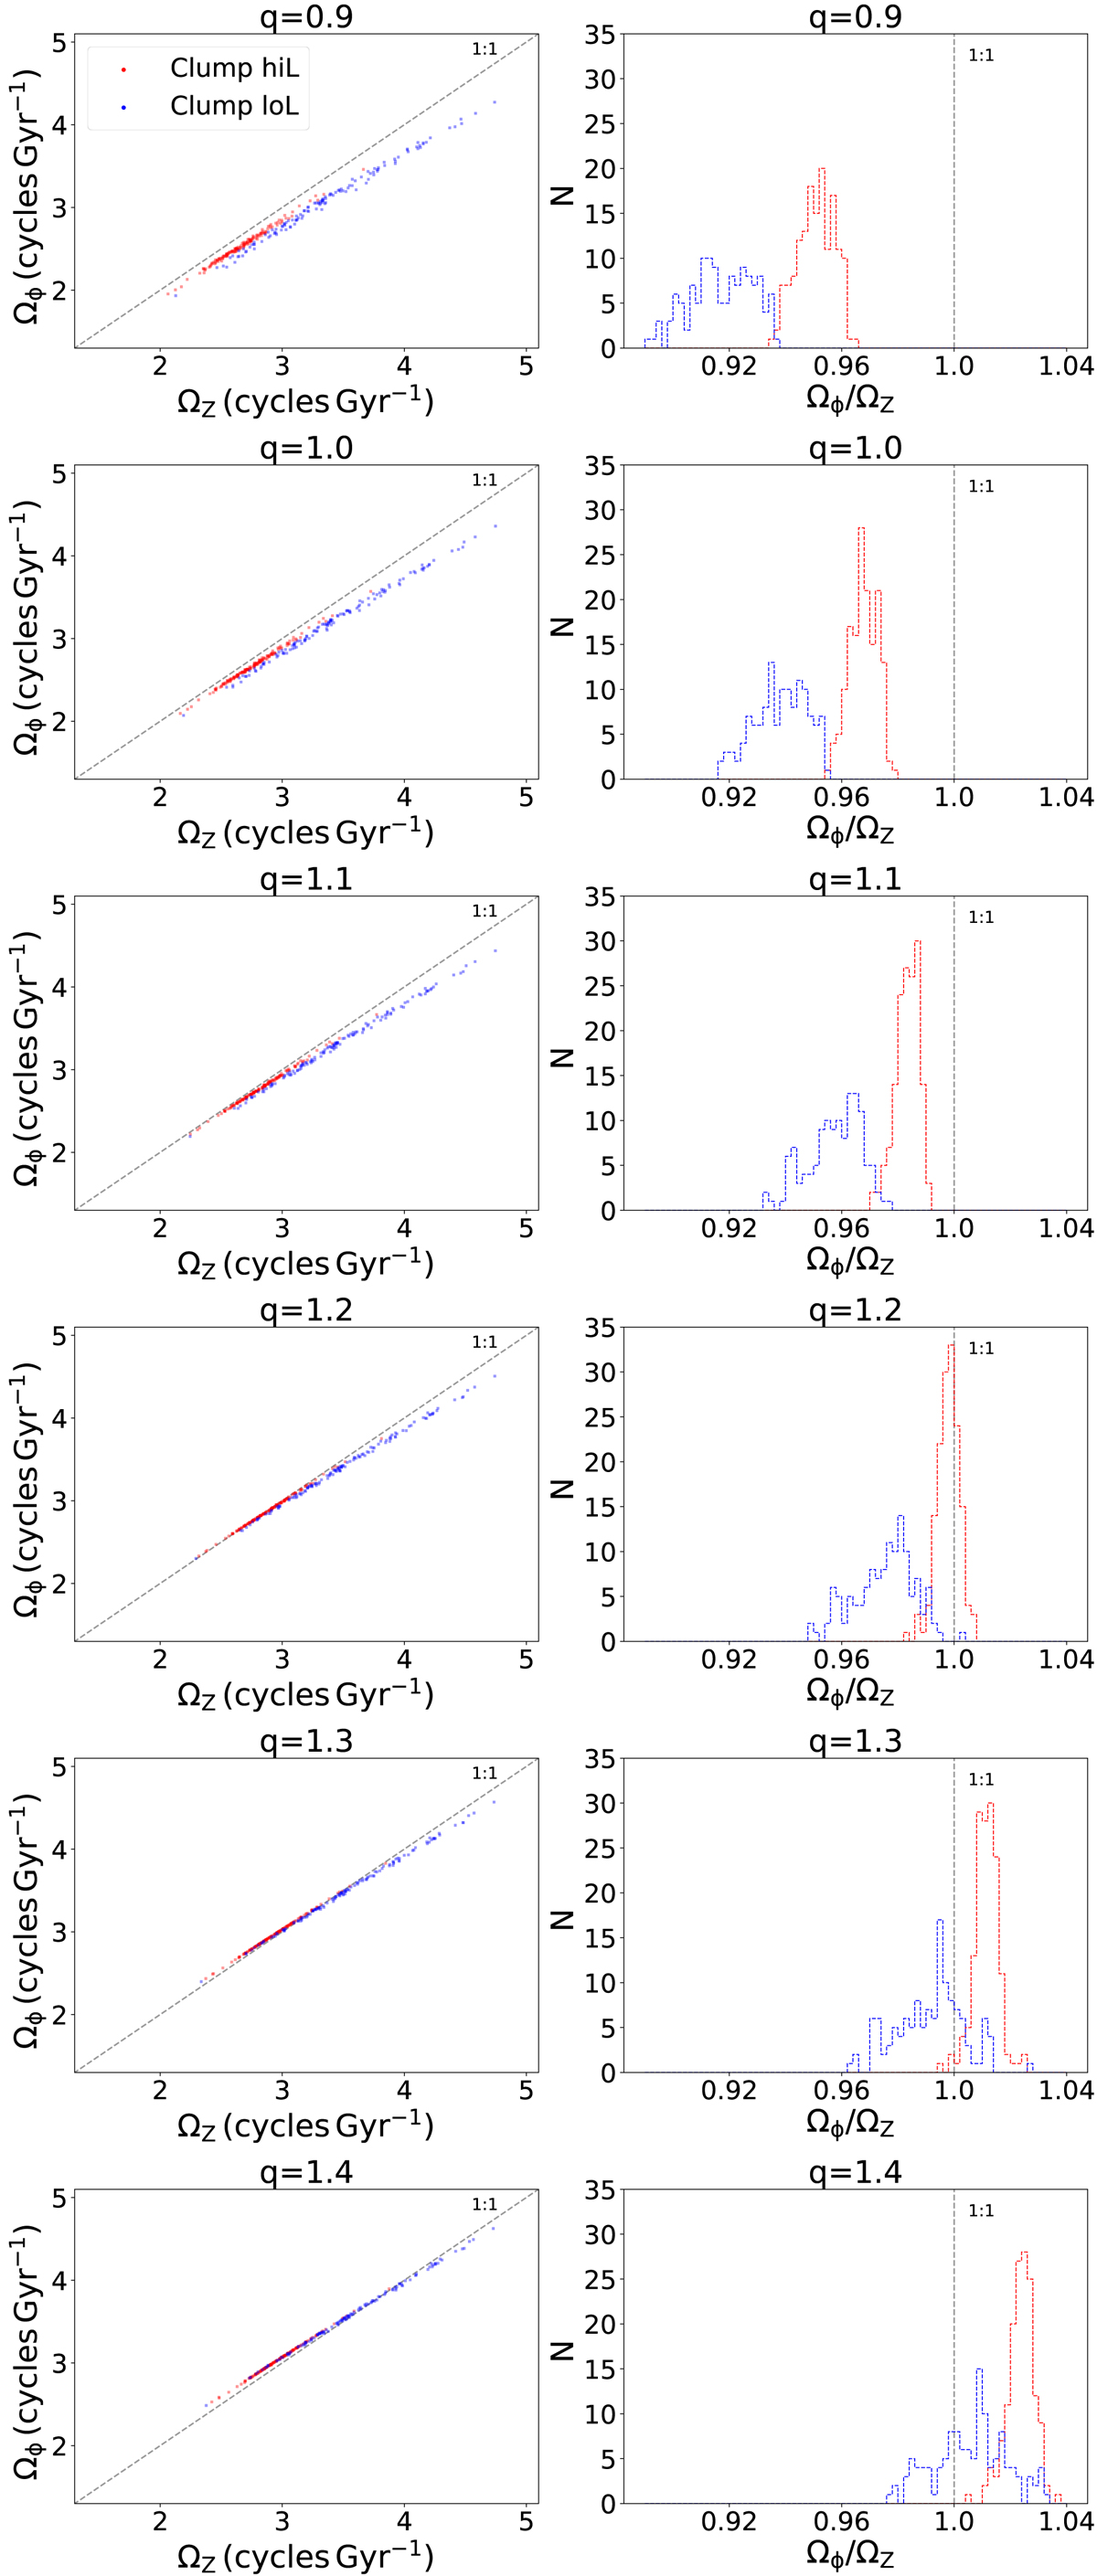
Download original image
Frequency, Ωϕ and Ωz, distributions (left column) and histograms of their ratios (right column) for all stars in the Helmi streams. Clump-hiL and Clump-loL stars are shown in red and blue, respectively. Each row shows a different flattening added to the McMillan (2017) halo component, with the axis ratio, q, increasing from 0.9 (oblate) to 1.4 (prolate).
Current usage metrics show cumulative count of Article Views (full-text article views including HTML views, PDF and ePub downloads, according to the available data) and Abstracts Views on Vision4Press platform.
Data correspond to usage on the plateform after 2015. The current usage metrics is available 48-96 hours after online publication and is updated daily on week days.
Initial download of the metrics may take a while.