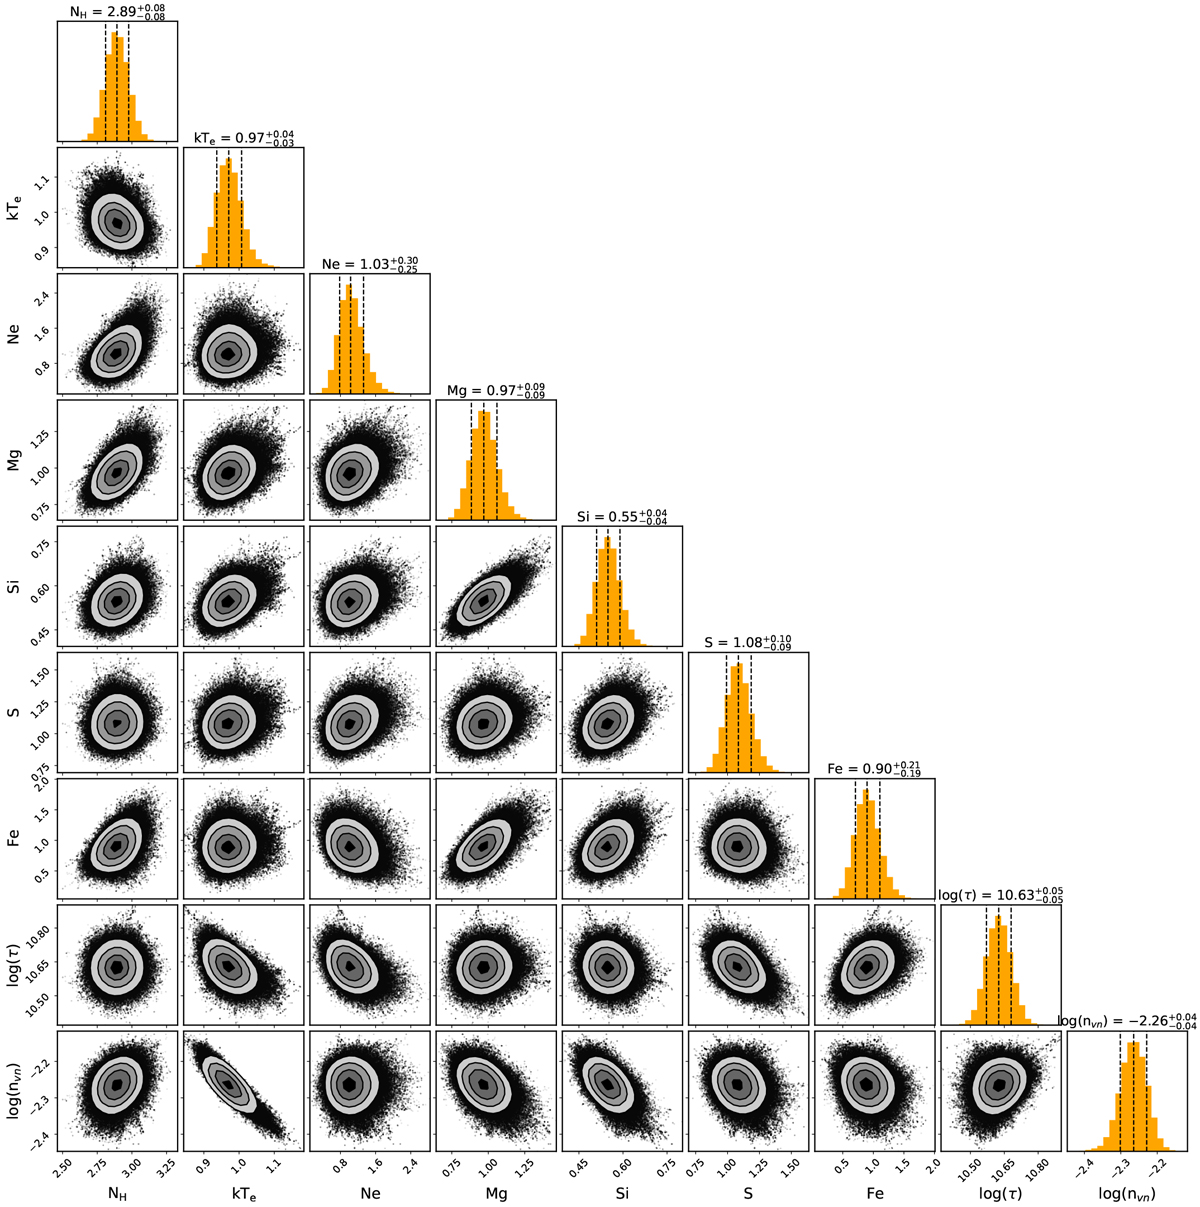
Fig. A.1
Download original image
Two-dimensional correlation distributions of the TBabs*vnei part of the model for region 1 of the SNR G53.41+0.03. Posterior distributions of individualparameters are described by the median and the 1σ confidence interval. Contours in the two-dimensional histogram represent 0.5, 1, 1.5, and 2σ levels. Instrumental line components are not displayed for readability reasons. Full version of the figure, including the instrumental line components, is available in the zenodo archive. (https://doi.org/10.5281/zenodo.4737383)
Current usage metrics show cumulative count of Article Views (full-text article views including HTML views, PDF and ePub downloads, according to the available data) and Abstracts Views on Vision4Press platform.
Data correspond to usage on the plateform after 2015. The current usage metrics is available 48-96 hours after online publication and is updated daily on week days.
Initial download of the metrics may take a while.