Free Access
Fig. 2
Download original image
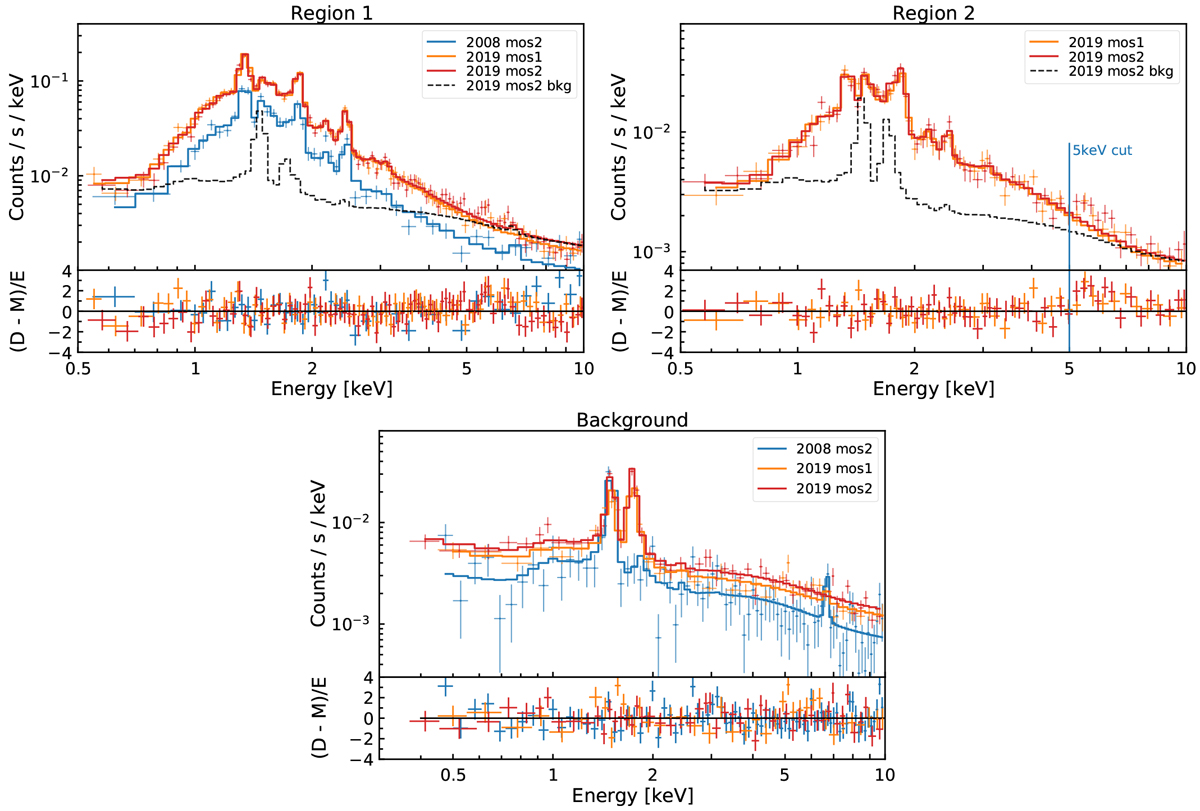
Best-fit models for the source and the background region spectra. A black dashed line shows the MOS 2 detector background model for individual regions. In region 2 we display the best-fit model fitted in the 0.5–5.0 keV energy range.
Current usage metrics show cumulative count of Article Views (full-text article views including HTML views, PDF and ePub downloads, according to the available data) and Abstracts Views on Vision4Press platform.
Data correspond to usage on the plateform after 2015. The current usage metrics is available 48-96 hours after online publication and is updated daily on week days.
Initial download of the metrics may take a while.